Infographics where the picture is the number.
Motionix is a free online infographic maker for statistics, ratios, funnels and comparisons. Draw the number instead of only stating it, let the parts appear in the order you explain them, and export a PNG or PDF, or a GIF or MP4 that plays.
The editor is free. No card needed.
HowThree steps
How it works
01
Find the shape of the data
A ratio, a share of a whole, a funnel, a ranking or a before and after. Each has a template to start from.
02
Draw it to scale
Make the parts as big as the numbers say, so the reader sees the answer before reading the label.
03
Size it for where it goes
LinkedIn and Instagram posts, a Pinterest pin, a 16:9 slide or an A4 handout, then export.
WhatFeatures
What makes a number land
Charts from your numbers
Attach a CSV or spreadsheet and Weave charts it on the canvas, as shapes you can restyle.
Parts that build in order
The headline, then the figure, then the source: each appears when you would point to it.
Every social size
LinkedIn carousel, Instagram portrait and story, Pinterest pin and X post sizes, plus slides and A4.
Icons and drawn objects
Icons from the built-in library, and shapes you can join, cut and repeat into a picture of the idea.
Text set properly
Lists, inline bold and colour, and characters such as CO₂ and m², so units and footnotes read the way they are written.
Exports for every use
PNG with a transparent background, SVG and PDF are free; GIF and MP4 bring the motion along.
ExamplesTemplates
Infographic templates
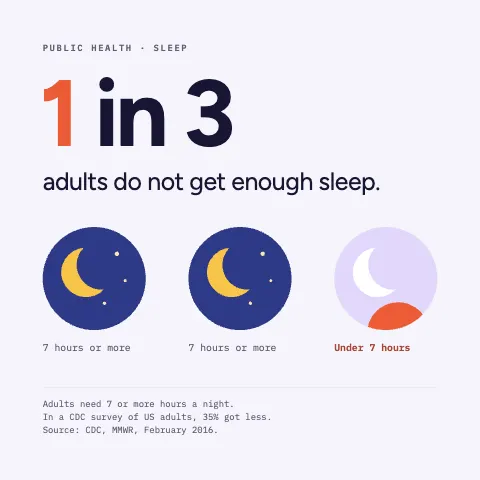
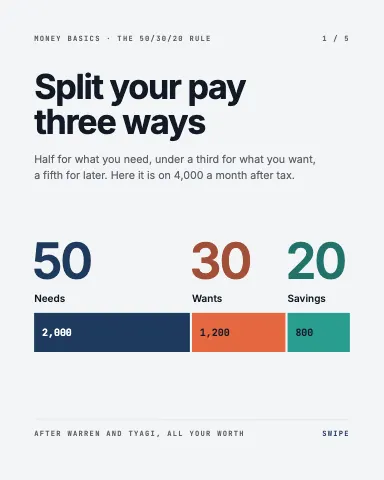
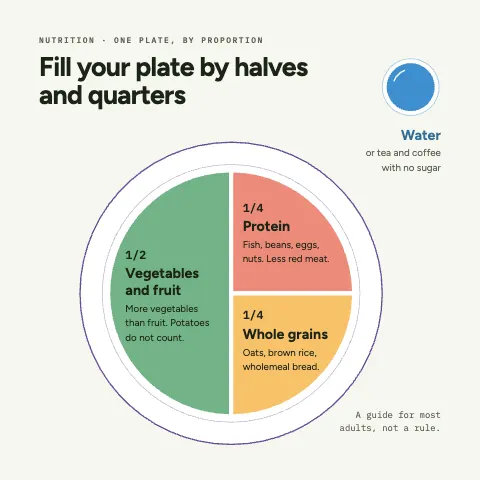
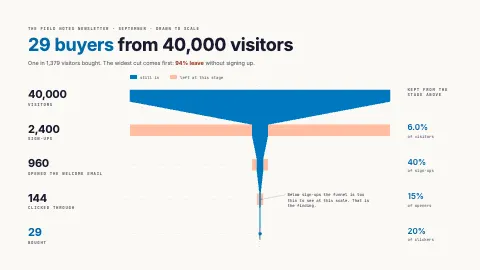
Each one is an ordinary page you can change. Open it, then edit, restyle or animate anything on it.
FAQQuestions
Questions, answered.
What makes a good infographic?
One message, a figure that shows it at a glance, and as few words as the reader needs. Draw quantities to scale, label the parts directly instead of using a legend, and name the source of the numbers.
Can I make an animated infographic?
Yes. Set the order the parts appear, add motion where it explains something, and export a GIF or MP4. The PDF and PNG show the finished infographic.
What size should an infographic be for social media?
For LinkedIn and Instagram feeds, 1080 by 1350 portrait takes the most room on a phone; 1080 by 1080 square also works. Pinterest favours 2:3 portrait pins. All three are presets.
Is the infographic maker free?
Yes. Making infographics, every template, and PNG, JPG, SVG and PDF export are free. GIF and video export, and Weave, come with Pro and Advanced.