Free templateMarketing funnel
Newsletter funnel, to scale
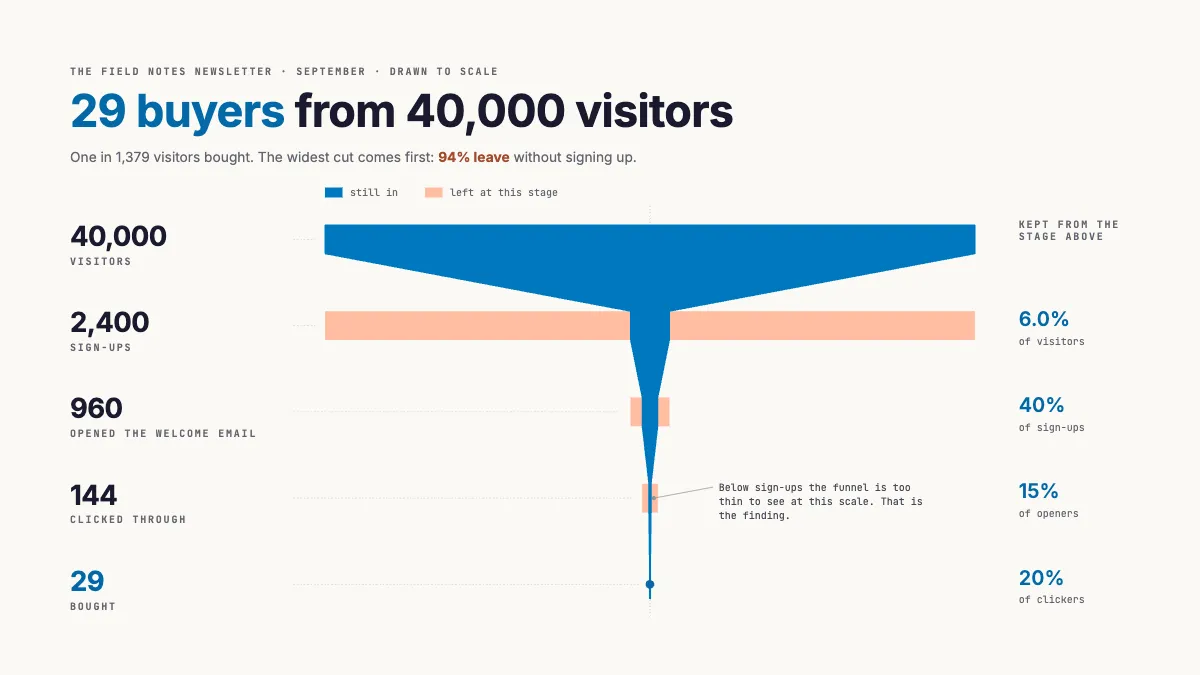
A newsletter funnel drawn to scale, from 40,000 visitors to 29 buyers, with the conversion kept at every stage.
Free. It opens in the Motionix editor as your own copy.
Download the pictureWebP, 1200 × 675, free to use. To change the words or colours, open it in the editor.
- Size
- 1920 × 1080 px
- Pages
- 1
- Motion
- Yes, plays live and in GIF or video
- Category
- Frameworks
What it shows
- Widths computed from counts
- Conversion between stages
- A margin note on the finding
Good for
How to use it
- Open the template. It becomes a project in your account.
- Change the words, colours and pictures. Every part is an ordinary shape, line or text box.
- Press Play to watch it build, then present it or export it.
What is a marketing funnel?
A marketing funnel is a model of the stages people pass through between first hearing about you and buying, with fewer people left at each stage. The classic version is AIDA: awareness, interest, desire and action. In practice most teams use stages they can count, such as visitors, sign-ups, opens, clicks and purchases, and watch the conversion rate between each pair.
When it helps
- A newsletter writer deciding whether to chase more visitors or fix a sign-up form that few people complete.
- A marketer reporting on a campaign by showing how many people reached each step.
- Comparing two months to find which stage changed when sales rose or fell.
- Choosing where an A/B test is likely to make the biggest difference.
Tips
- Track the same people through every stage where you can. Totals pulled from different tools often double count, and a stage bigger than the one above it is the tell.
- Drawn to scale, the bottom of a funnel is a sliver. That is honest: most visitors to any site never buy, so judge each step against its own past.
- Improve the top only when the lower steps convert well. Doubling traffic into a broken sign-up form just doubles the number of people who leave.
How to build a marketing funnel
Define each stage as an event
Pick stages you can count: a page view, a form submitted, an email opened, a link clicked, an order placed. A stage called "interest" cannot be measured, so it cannot be improved.
Count people at every stage
Use one period, such as a month, and count unique people rather than visits. Each stage should be a subset of the one above it.
Work out each step's conversion
Divide each stage by the one before it. For instance, 2,400 sign-ups from 40,000 visitors is 6%, and 29 buyers from 144 clickers is about 20%.
Draw it to scale
Make each band's width proportional to its count. A to-scale funnel shows where people really leave, while one with neat, evenly shrinking bands hides it.
Find the biggest loss
Look for the step that loses the most people, or the rate that has fallen furthest from its own history. That is where to work first.
Change one thing and remeasure
Write one hypothesis for the weakest step, such as a shorter sign-up form, make the change and measure the same funnel over the same length of period again.
FAQQuestions
Common questions.
What are the stages of a marketing funnel?
The classic model is AIDA: awareness, interest, desire and action. Many teams talk about the top, middle and bottom of the funnel instead, or name stages after measurable events such as visit, sign-up, trial and purchase. Some add retention and referral after the sale.
What is a good funnel conversion rate?
There is no single answer: it depends on the step, the price and the audience. Compare each step with its own history and with honest benchmarks from similar businesses. A small, steady gain at the weakest step usually beats chasing an industry average.
What is the difference between a sales funnel and a marketing funnel?
A marketing funnel covers how people discover you and become leads, such as visitors who subscribe. A sales funnel picks up from there and covers turning leads into paying customers. Many small businesses draw both as one funnel, from first visit to purchase.
More frameworks templates
Matrices, org charts, canvases and models for thinking.