Free templateStatistic infographic post
One in three
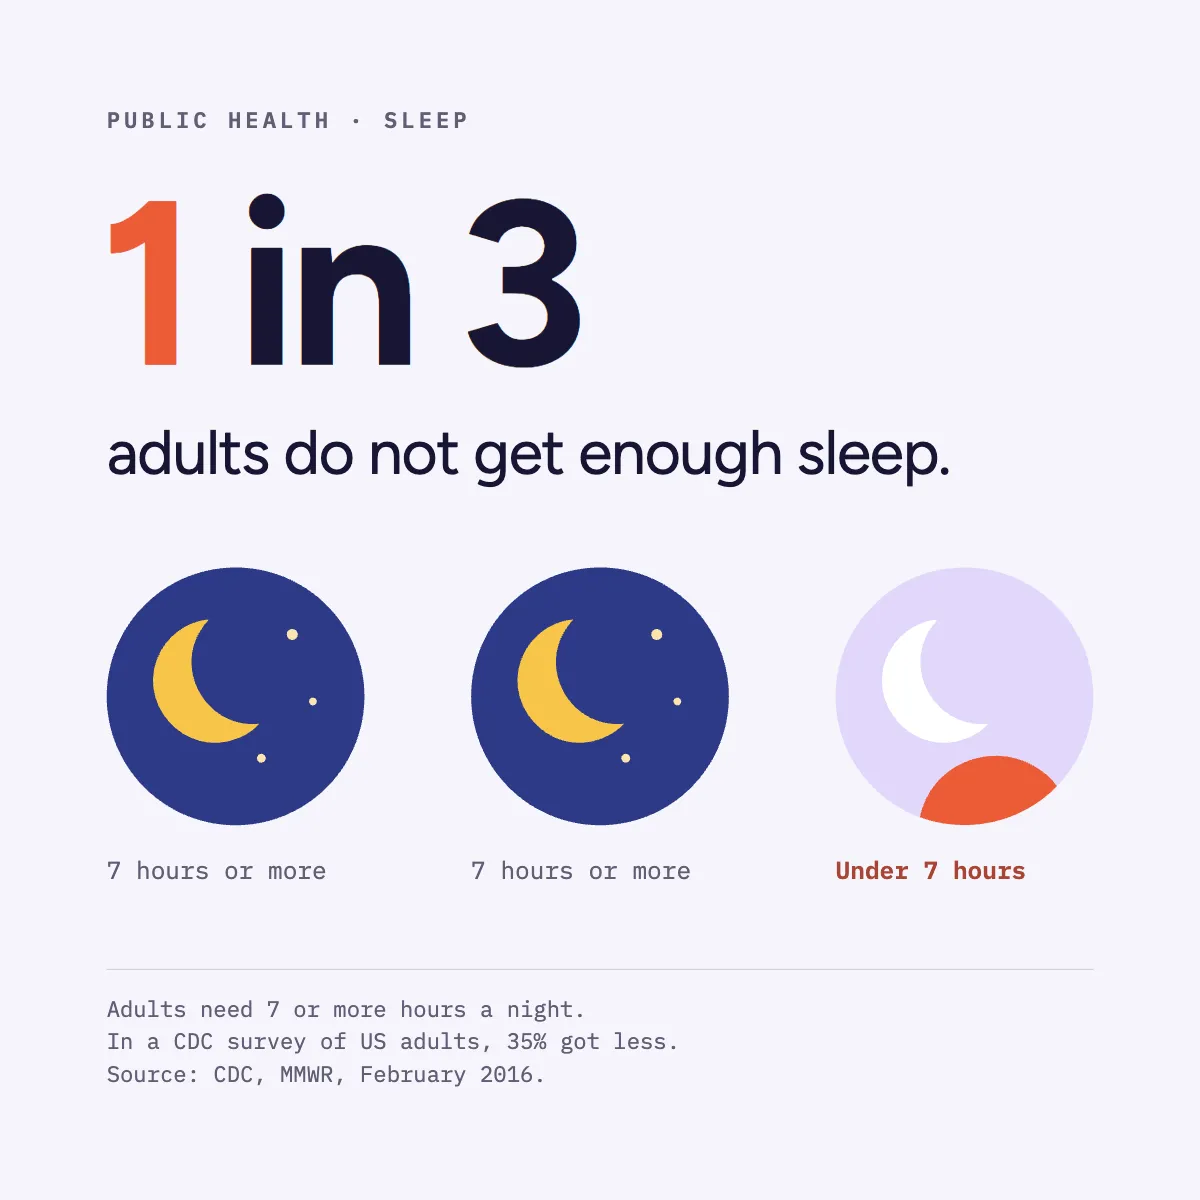
A public health statistic where the figure is the ratio: three crescent moons, one filled for the night that ran short.
Free. It opens in the Motionix editor as your own copy.
Download the pictureWebP, 1200 × 1200, free to use. To change the words or colours, open it in the editor.
- Size
- 1080 × 1080 px
- Pages
- 1
- Motion
- Yes, plays live and in GIF or video
- Category
- Social posts
What it shows
- A figure that is the number
- Boolean-cut shapes
- Source line
Good for
How to use it
- Open the template. It becomes a project in your account.
- Change the words, colours and pictures. Every part is an ordinary shape, line or text box.
- Press Play to watch it build, then present it or export it.
What is a statistic infographic post?
A statistic infographic post makes one number the whole message, set large and drawn as a picture of itself, with a short line of context and a source. Instead of a chart with many values, it shows a single ratio people can repeat, such as one in three adults not getting enough sleep, drawn as three moons with one marked differently.
When it helps
- A public health team sharing one survey finding in a form people will remember and repeat.
- A charity opening an awareness week with the single figure that frames its campaign.
- A researcher promoting a new paper with its headline result and a link to the source.
- A teacher showing pupils how a ratio like one in three can be drawn rather than written.
Tips
- Check whether rounding flatters the story. Calling 26% "one in four" is fair; calling it "one in three" is not, and careful readers will notice.
- Use one accent colour for the part that matters, such as the short night, and keep everything else neutral so the eye lands there first.
- Say where the data comes from as well as who published it: "a survey of US adults" stops people applying an American figure to another country.
How to design a statistic infographic
Pick one number
Choose the single figure that carries the message and leave the rest for a caption or linked report. Two statistics on one image compete for attention.
Turn it into a ratio
Thirty-five per cent is accurate; "one in three" is memorable. Round only where it stays honest, and keep the exact figure in the small print.
Draw the number
Show the ratio as countable things, such as three moons with one different, so the picture is the figure. Avoid decorative icons that encode nothing.
Write the context line
Under the number, say who it applies to and what the threshold is: adults, seven or more hours a night. Without that, the number means nothing.
Add the source
Name the organisation, the publication and the date in small type at the foot, for example CDC, MMWR, February 2016.
FAQQuestions
Common questions.
How many adults do not get enough sleep?
A CDC analysis published in 2016 found that about 35% of US adults reported usually sleeping less than seven hours a night, the minimum recommended for adults. Figures for other countries vary with how and when each survey was done.
How do you cite a source on an infographic?
Give the organisation, the title or publication and the date in small type near the bottom, for example "Source: CDC, MMWR, February 2016". In the caption, add a link or full reference so anyone can check the figure themselves.
What makes a statistic easy to remember?
A simple ratio, a concrete group and a picture. "One in three adults" is easier to hold than a percentage with a decimal point, and drawing three objects with one marked lets people see it without reading. Tying it to a familiar experience, like a short night, helps too.
More social posts templates
Carousels, stories and single posts for LinkedIn and Instagram.