GuideAbout 15 minutes
How to animate an architecture diagram
The short answer
Draw the services as shapes or icons, connect them with Motionix connectors, give each connector a flow such as Packet or Dashes in its Motion chapter, and export a GIF or MP4. The motion shows which way traffic goes and which work happens later.
What you need
- A Motionix account (free)
- Pro or Advanced for GIF and video export
- Nothing to install: it runs in the browser
Step 1Lay out the system
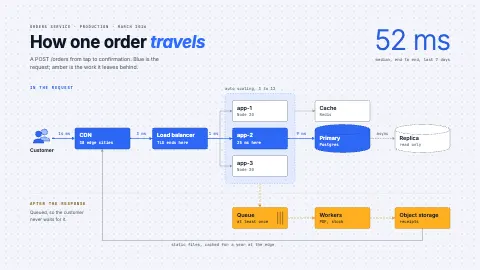
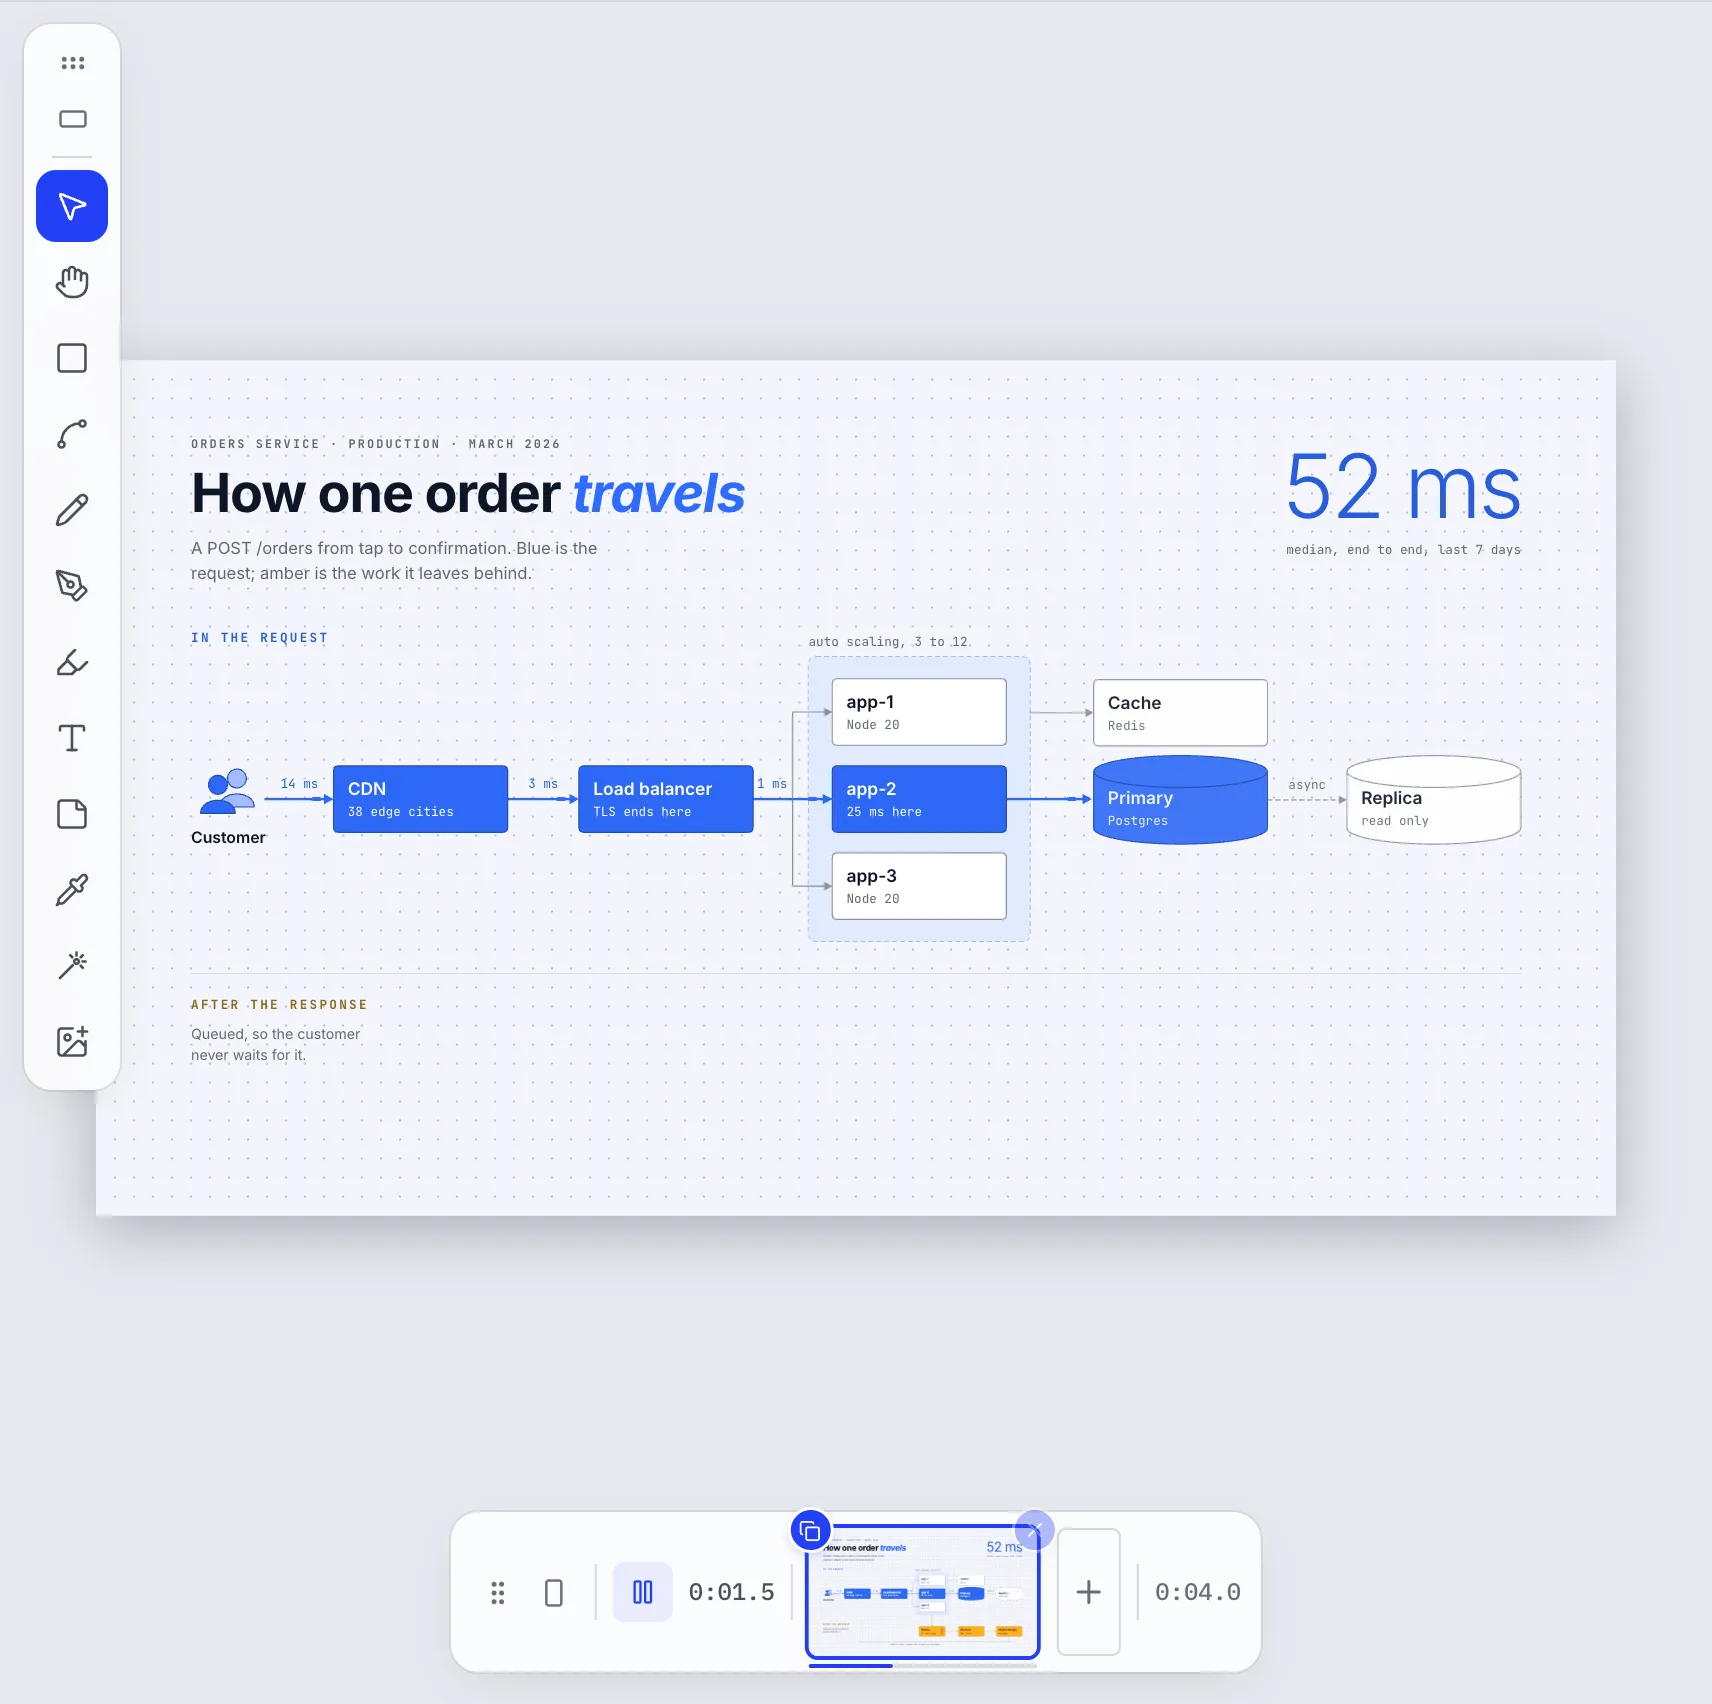
Open the Web app architecture template, or start blank. Draw services, queues and databases as shapes (press R; the Shapes panel on the left has cylinders for databases), add icons from the Icons panel, and connect each caller to what it calls with the Connector tool (C).
Step 2Make the traffic visible
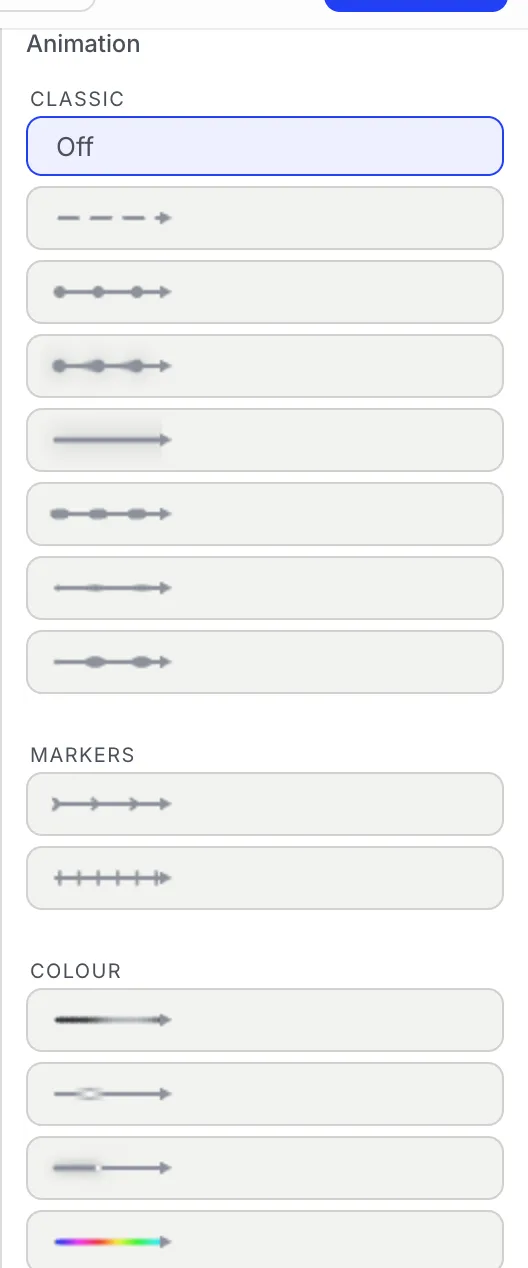
Select a connector and choose an effect in Motion, Animation. Packet sends a token along the line, good for requests; Dashes reads as a steady stream. Give the request path one colour and the queued work another, and use Direction for replies or two-way links.
Step 3Tell the story in order, if it has one
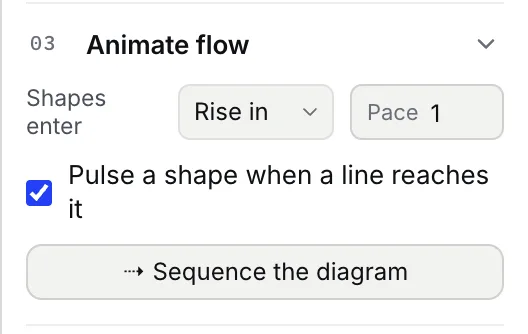
With nothing selected, open Animate flow and press Sequence the diagram: each service appears as the request reaches it. Skip this for a diagram that should simply run, with every line flowing at once.
Step 4Export for the README or the review
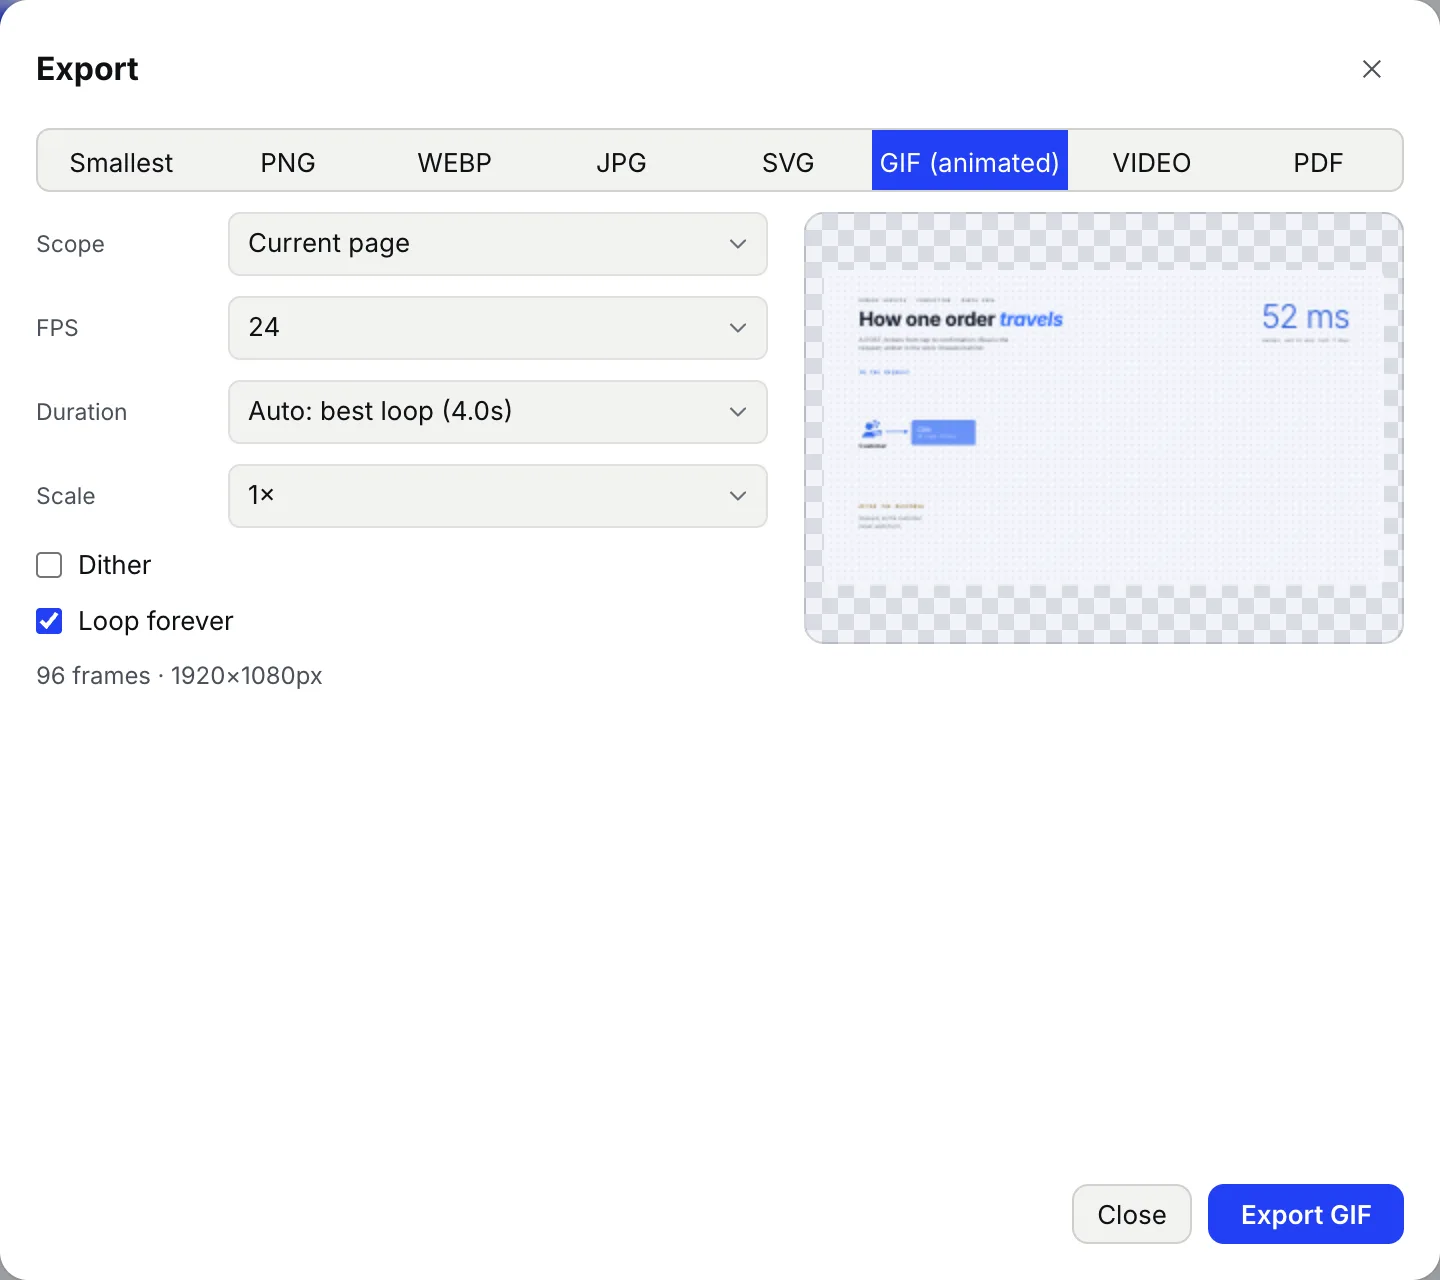
Press Export, choose GIF (animated) for a README or a pull request, or VIDEO for slides. Auto: best loop keeps it seamless. For a design doc, SVG on any plan gives the finished diagram as vectors. GIF and video export come with Pro and Advanced. Everything before the export button is free.
Tips
- Label each connector with what it carries or how long it takes; the label moves with the line.
- GitHub plays GIFs inline: drag the exported file into the README editor or a pull request comment.
- Keep one effect for the request path and another for background work, so a reader can tell them apart at a glance.
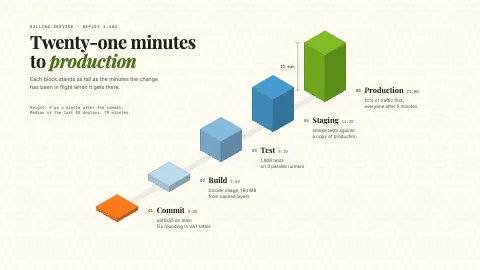
- Isometric planes in the Build chapter give a rack or cloud view depth when a flat diagram is not enough.
Checked against Motionix on 2026-10-21.