Free templateCI/CD pipeline diagram
Commit to production
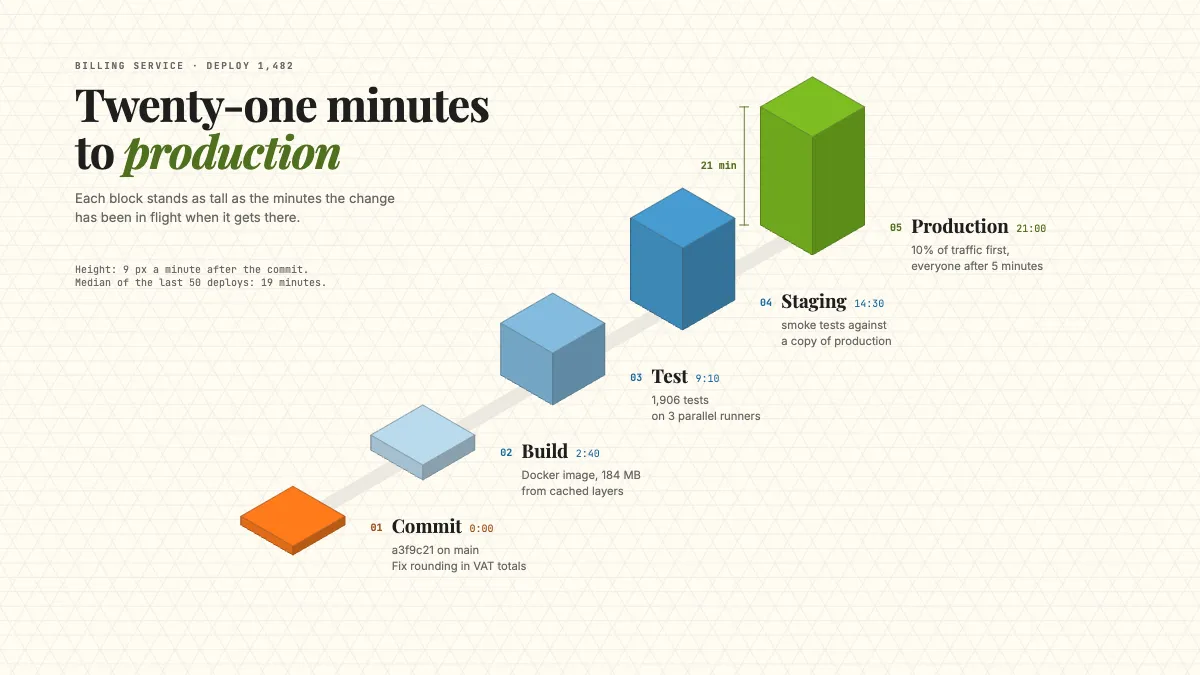
A CI/CD pipeline in isometric: five blocks on one road, each as tall as the minutes elapsed, with the change travelling through.
Free. It opens in the Motionix editor as your own copy.
Download the pictureWebP, 1200 × 675, free to use. To change the words or colours, open it in the editor.
- Size
- 1920 × 1080 px
- Pages
- 1
- Motion
- Yes, plays live and in GIF or video
- Category
- Technical
What it shows
- Isometric blocks on a lattice
- Height drawn to scale
- A packet travelling the road
Good for
How to use it
- Open the template. It becomes a project in your account.
- Change the words, colours and pictures. Every part is an ordinary shape, line or text box.
- Press Play to watch it build, then present it or export it.
What is a CI/CD pipeline diagram?
A CI/CD pipeline diagram shows the automated steps a code change passes through from commit to production. Continuous integration builds and tests every change as soon as it is pushed; continuous delivery or deployment then releases it, usually via a staging environment and a gradual rollout. A useful diagram names each stage, what it runs and how long it takes, so the team can see where the minutes go.
When it helps
- A platform team explaining to developers why a change takes about twenty minutes to reach production.
- Finding the slowest stage before investing in faster tests or build caching.
- An engineering blog post or talk about how a team ships safely several times a day.
- Onboarding developers so they know which checks their change must pass.
Tips
- Testing is often the longest stage. Splitting the suite across parallel runners can save more minutes than anything else, so show the runner count on the diagram.
- Draw the rollout, not just the deploy. "10% of traffic first, everyone after 5 minutes" tells readers how risk is managed.
- Diagram the stages, not the vendors. Rows of product logos date quickly; stage names and timings stay true when you change providers.
How to draw a CI/CD pipeline diagram
List the stages in order
Write each step a change goes through, typically commit, build, test, staging and production. Add security scans or manual approvals if your pipeline has them.
Say what each stage does
Under each name, note the concrete work: the image built, the number of tests and runners, the smoke tests against staging, the rollout rule.
Add the elapsed time
Mark when the change reaches each stage, measured from the commit. Elapsed time shows how long a developer actually waits, which is what most people care about.
Make time visible
Size each stage, by height or length, in proportion to its time, so the slowest step stands out before anyone reads a number.
Mark the gates
Show where the pipeline stops if something fails, and where a person must approve. A failing test should visibly stop the change before it reaches staging.
Use a typical run
Base timings on the median of recent runs and say so, not the best case. One unusually fast run is not what developers live with.
FAQQuestions
Common questions.
What is the difference between continuous delivery and continuous deployment?
With continuous delivery, every change that passes the pipeline is ready to release, but a person decides when it goes live. With continuous deployment, every passing change is released to production automatically, with no manual step. Both depend on continuous integration coming first.
What are the stages of a CI/CD pipeline?
Most pipelines have source, where a commit triggers a run; build, which compiles code or builds a container image; test, from unit tests to integration tests; staging, a production-like environment for final checks; and the production deployment, often gradual through canary or blue-green releases.
What is a canary release?
It is a rollout in which a new version first serves a small share of traffic, such as 10%, while the team watches error rates and latency. If the numbers stay healthy, it goes to everyone; if not, it is rolled back before most users notice anything.
More technical templates
Architecture, networks, circuits, plans and data.