Free templateData pipeline diagram
Data pipeline
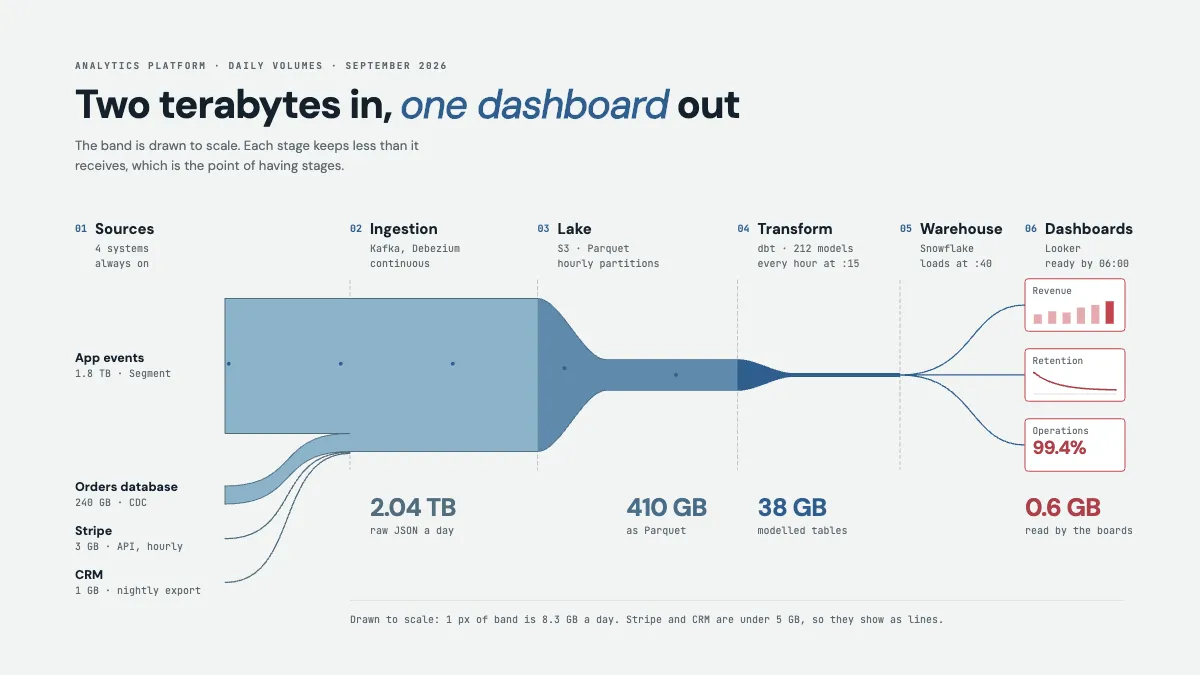
Sources to lake to warehouse to dashboards, drawn as a river whose width is the daily volume, with every schedule and size marked.
Free. It opens in the Motionix editor as your own copy.
Download the pictureWebP, 1200 × 675, free to use. To change the words or colours, open it in the editor.
- Size
- 1920 × 1080 px
- Pages
- 1
- Motion
- Yes, plays live and in GIF or video
- Category
- Technical
What it shows
- A band drawn to scale
- Schedules on every stage
- Data travelling left to right
Good for
How to use it
- Open the template. It becomes a project in your account.
- Change the words, colours and pictures. Every part is an ordinary shape, line or text box.
- Press Play to watch it build, then present it or export it.
What is a data pipeline diagram?
A data pipeline diagram shows how data travels from the systems that create it to the places people use it, stage by stage. A typical analytics pipeline runs from sources such as app events and databases, through ingestion, a data lake, a transformation layer and a warehouse, to dashboards. Good diagrams mark each stage's tool, schedule and data volume, so readers can see when data arrives and where it shrinks.
When it helps
- A data engineer explaining to analysts why yesterday's numbers are not ready until 6:00.
- Planning a migration, by listing every source, tool and schedule the new platform must replace.
- Investigating a storage bill by seeing which stage holds the most data.
- Onboarding a new analyst who needs to know where a dashboard's numbers come from.
Tips
- Draw dependencies, not just order. If transformation runs at :15 and the load at :40, show that the warehouse waits on it, so a slow model visibly delays the dashboards.
- Show change data capture apart from batch exports. Streaming and nightly sources fail in different ways, and lumping them together hides why some numbers are fresher.
- Stay at the level of stages. Individual tables belong in a lineage tool; a pipeline diagram that tries to show 212 models ends up showing none of them.
How to draw a data pipeline diagram
List the sources
Write down every system that feeds the pipeline, such as product events, the orders database, a payment provider and the CRM, with roughly how much data each sends a day.
Draw the stages left to right
Place ingestion, storage, transformation, warehouse and consumption in the order data passes through them. Number them, so people can say "stage 3" in a conversation.
Name the tool and schedule
Under each stage, write the technology and when it runs: continuous, hourly at :15, nightly. Schedules answer most questions about missing or late data.
Show the volume
Mark the data size at each stage, or draw the flow with a width in proportion to it. Raw data shrinks as it is compressed, filtered and modelled.
End at the consumers
Draw the dashboards, reports or models that read the final tables, and note when they must be ready. That deadline sets the timing for everything upstream.
FAQQuestions
Common questions.
What is the difference between ETL and ELT?
ETL means extract, transform, load: data is cleaned and reshaped before it reaches the warehouse. ELT means extract, load, transform: raw data is loaded first and transformed inside the warehouse, often with SQL-based tools such as dbt. Cheap storage and fast warehouses have made ELT common for analytics.
What is the difference between a data lake and a data warehouse?
A data lake stores large amounts of raw data cheaply in open file formats such as Parquet, without a fixed structure. A data warehouse stores cleaned, structured tables built for fast queries. Many pipelines use both: the lake keeps everything, and the warehouse holds what analysts query.
What are the stages of a data pipeline?
Most pipelines have ingestion, which collects data from sources; storage, often a lake; transformation, which cleans, joins and models the data; serving, usually a warehouse; and consumption, such as dashboards, reports or machine learning. Orchestration and monitoring run alongside every stage.
More technical templates
Architecture, networks, circuits, plans and data.