Free templateP&ID diagram
Water treatment P&ID
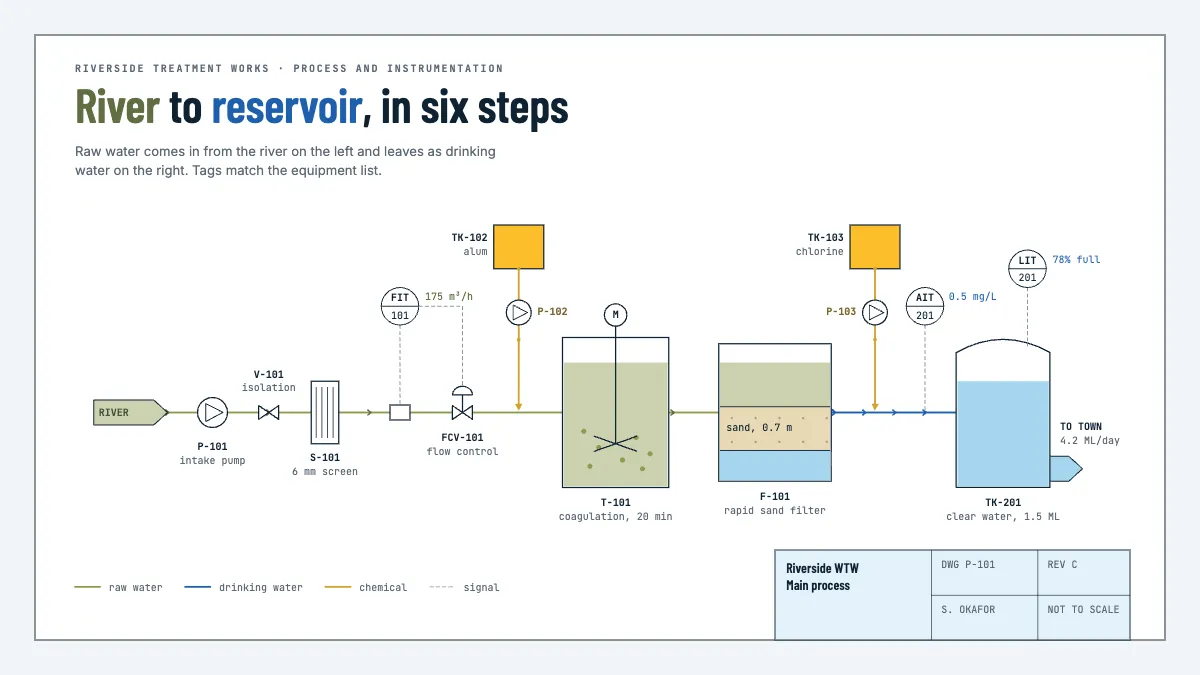
A drawing sheet of a small treatment works: intake, screen, coagulation, filter, chlorine dosing and storage, with valves, pumps and tagged instruments.
Free. It opens in the Motionix editor as your own copy.
Download the pictureWebP, 1200 × 675, free to use. To change the words or colours, open it in the editor.
- Size
- 1920 × 1080 px
- Pages
- 1
- Motion
- Yes, plays live and in GIF or video
- Category
- Technical
What it shows
- Standard P&ID symbols
- Tagged instrument bubbles
- A drawing sheet title block
Good for
How to use it
- Open the template. It becomes a project in your account.
- Change the words, colours and pictures. Every part is an ordinary shape, line or text box.
- Press Play to watch it build, then present it or export it.
What is a P&ID diagram?
A P&ID, or piping and instrumentation diagram, is a detailed drawing of a process plant showing its equipment, pipes, valves, pumps and the instruments that measure and control the process. Every item carries a tag, such as P-101 for a pump or FIT-101 for a flow transmitter, matching the equipment and instrument lists. Instrument symbols and tags usually follow the ISA-5.1 standard.
When it helps
- A process engineer designing a small water treatment works and specifying each valve and instrument.
- An operator learning a plant before a first shift in the control room.
- A HAZOP study, where the team works through the drawing line by line looking for deviations.
- Planning maintenance, by finding which valves isolate a pump before it is removed.
Tips
- Keep tag letters strict. FIT is a flow indicating transmitter, LIT a level one and AIT an analyser; a wrong first letter sends a technician to the wrong instrument.
- Give every instrument and valve a tag that matches the equipment list and the control system, so a reading on screen can be traced to one place on the drawing.
- A P&ID is not drawn to scale and is not a layout. Keep the process flowing left to right for clarity and leave physical positions to the plant layout drawings.
How to draw a P&ID
Lay out the main process line
Run the main flow from left to right, from intake to outlet, with each major unit in order. In a small water works that means intake pump, screen, coagulation, filtration, disinfection and storage.
Use standard equipment symbols
Draw a pump as a circle, a valve as a bowtie, a control valve as a bowtie with an actuator on its stem, and tanks and vessels as outlines. Tag every item.
Add the instruments
Draw each instrument as a circle, or bubble, with letters above a loop number. The first letter is the measured variable, such as F for flow or L for level; later letters give the function.
Draw signals differently from pipes
Join instruments to what they measure and control with dashed signal lines. A flow transmitter linked to a flow control valve shows a control loop at a glance.
Show chemical and utility lines
Draw dosing lines, such as coagulant or chlorine, where they join the process, with their storage tanks and metering pumps. Give each kind of stream its own line in the legend.
Finish with a title block
Add the drawing number, revision, author, date and a scale note. A P&ID is a controlled document, so the revision letter matters as much as the drawing.
FAQQuestions
Common questions.
What is the difference between a PFD and a P&ID?
A process flow diagram (PFD) shows the main process: major equipment, the main streams and operating conditions, with little detail. A P&ID adds every pipe, valve, instrument, control loop and tag needed to build, operate and maintain the plant. PFDs come first in a design; P&IDs follow.
What do the letters in a P&ID instrument tag mean?
Under ISA-5.1, the first letter is the measured or initiating variable, such as F for flow, L for level, P for pressure, T for temperature and A for analysis. The letters after it give the function, such as I for indicate, T for transmit and C for control. The number identifies the loop.
What standard is used for P&ID symbols?
ISA-5.1, Instrumentation Symbols and Identification, from the International Society of Automation, is the most widely used for instrument symbols and tags. ISO 10628 covers flow diagrams for process plants, and most companies keep their own legend sheet, which should travel with the drawings.
More technical templates
Architecture, networks, circuits, plans and data.