Free templateProduction line diagram
Bottling line
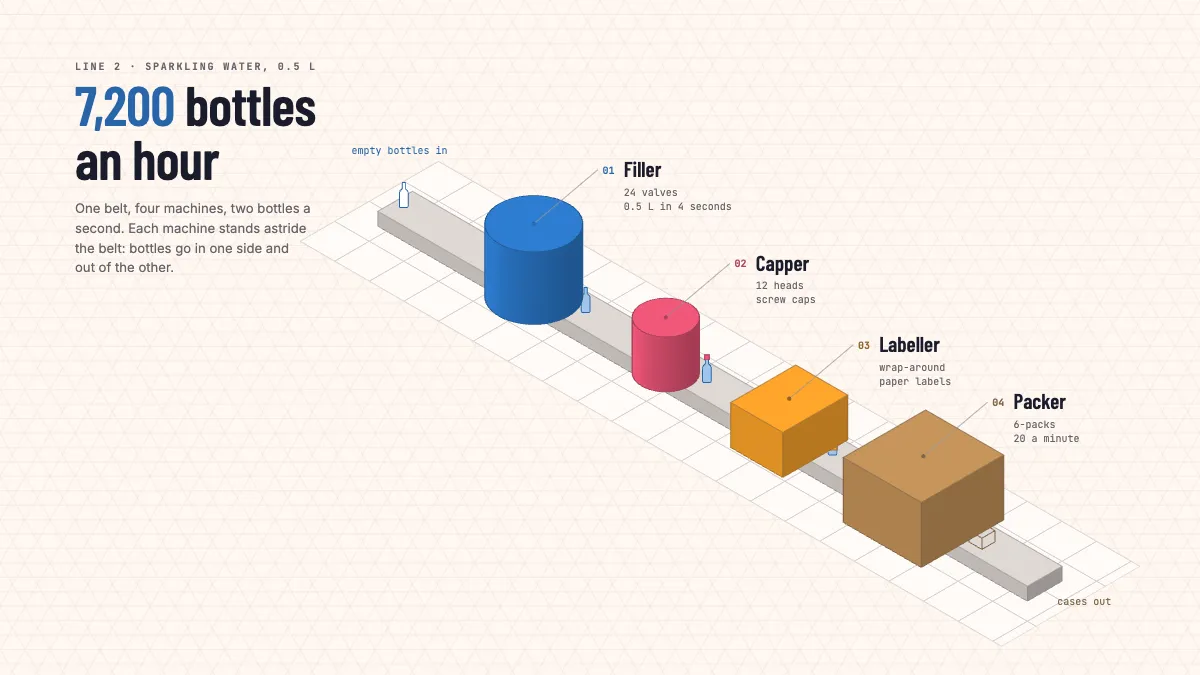
An isometric bottling line: filler, capper, labeller and packer astride one conveyor, with bottles riding through and cases coming out.
Free. It opens in the Motionix editor as your own copy.
Download the pictureWebP, 1200 × 675, free to use. To change the words or colours, open it in the editor.
- Size
- 1920 × 1080 px
- Pages
- 1
- Motion
- Yes, plays live and in GIF or video
- Category
- Technical
What it shows
- Isometric machines on a lattice
- Bottles moving along the belt
- Line rate as motion
Good for
How to use it
- Open the template. It becomes a project in your account.
- Change the words, colours and pictures. Every part is an ordinary shape, line or text box.
- Press Play to watch it build, then present it or export it.
What is a production line diagram?
A production line diagram shows the machines on a manufacturing line in the order the product passes through them, and how it travels between them. For a bottling line that usually means a filler, a capper, a labeller and a packer joined by a conveyor, with empty bottles going in at one end and cases coming out at the other. Good diagrams mark each machine's rate, so the bottleneck shows.
When it helps
- A manufacturing engineer planning a new line and checking every machine can keep pace with the target rate.
- Training new operators on what each station does and what comes after it.
- Finding the bottleneck when output falls short of the line's rated speed.
- A proposal showing a customer or the board how a new product will be made.
Tips
- Leave buffer space between machines. A short accumulation length lets an upstream machine keep running while a downstream jam is cleared, which often matters as much as speed.
- Lines are usually built around the filler as the constraint, with machines after it set slightly faster, so a brief stop downstream does not halt the most expensive machine.
- Rated speed is not output. Allow for changeovers, stops and rejects; overall equipment effectiveness, or OEE, measures how much of the rated speed a line really achieves.
How to draw a production line diagram
List the operations in order
Write down every step the product goes through, from raw item to packed case. On a bottling line that is fill, cap, label and pack, plus any inspection or accumulation.
Draw the conveyor first
Lay down the belt or transfer path as the spine, then place each machine on it in sequence. An isometric view helps when machines straddle the belt or the line turns a corner.
Mark the rate at each machine
Note each machine's capacity, such as 24 filling valves or 20 cases a minute. The whole line runs only as fast as its slowest machine allows.
Check the rates agree
Convert every rate to one unit. At 7,200 bottles an hour the belt moves two bottles a second, so a packer making six-packs must manage 20 cases a minute.
Show the product changing
Draw the item as it looks after each machine: empty, filled, capped, labelled, packed. Readers then see at once what each station adds.
FAQQuestions
Common questions.
What is a bottleneck on a production line?
It is the machine or step with the lowest capacity, which limits the output of the whole line. Speeding up any other machine adds nothing until the bottleneck improves. You can find it by comparing each machine's rate or by watching where product queues up.
What is line balancing?
Line balancing means sharing the work across stations so each takes roughly the same time, known as the cycle time. A balanced line has less idle time and shorter queues. When one station cannot be sped up, work is moved off it or the station is doubled.
What is takt time?
Takt time is the pace at which you must finish products to meet customer demand: available production time divided by the number of units needed. If a shift has 25,200 seconds of running time and needs 12,600 bottles, the takt time is two seconds a bottle.
More technical templates
Architecture, networks, circuits, plans and data.