Free templateSleep cycle diagram
A night of sleep
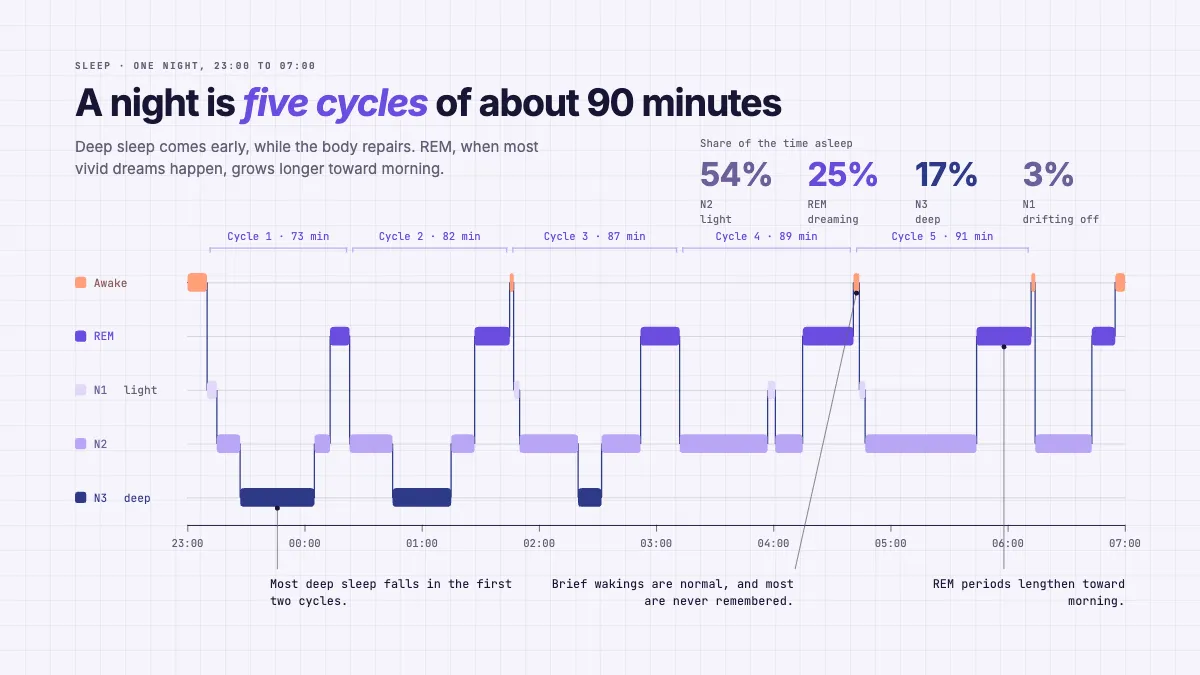
A hypnogram computed from a believable night: five cycles, deep sleep early, REM growing toward morning.
Free. It opens in the Motionix editor as your own copy.
Download the pictureWebP, 1200 × 675, free to use. To change the words or colours, open it in the editor.
- Size
- 1920 × 1080 px
- Pages
- 1
- Motion
- Yes, plays live and in GIF or video
- Category
- Health and science
What it shows
- Computed step chart
- Shares measured from the data
- Trace that draws itself
Good for
How to use it
- Open the template. It becomes a project in your account.
- Change the words, colours and pictures. Every part is an ordinary shape, line or text box.
- Press Play to watch it build, then present it or export it.
What is a sleep cycle diagram?
A sleep cycle diagram, often drawn as a hypnogram, plots the stage of sleep minute by minute through one night. Sleep is scored as awake, REM and three non-REM stages, N1, N2 and N3, and the trace steps between them in cycles of roughly 90 minutes. Most adults pass through four to six cycles, with deep N3 sleep concentrated early and REM periods lengthening toward morning.
When it helps
- A psychology or neuroscience lecture introducing the stages of sleep and how they are scored.
- A sleep clinic explaining to a patient what their overnight study measured.
- Health education on why waking briefly in the night is usually normal.
- A revision sheet for students learning the differences between REM and non-REM sleep.
Tips
- Base the trace on a believable night, not a perfectly regular one; real hypnograms have uneven cycles and short awakenings, and students trust a chart that looks measured.
- If you print stage percentages, compute them from the same data as the trace so the two cannot disagree.
- Keep N1 and N2 visibly related in colour; they are both light sleep, while N3 and REM deserve the strongest contrast.
How to draw a hypnogram of a night of sleep
Set time along the bottom
Run clock time from lights out to waking across the horizontal axis, with a tick every hour, so the length of each cycle can be read directly.
Stack the stages as rows
Put awake at the top, then REM, N1, N2 and N3 at the bottom. Placing REM near waking reflects how active the brain is during it.
Draw the trace as steps
Sleep is scored in short blocks, so the line moves in flat runs and vertical jumps, never smooth curves. Each change of stage is a step.
Bracket each cycle
Mark where each cycle ends, usually at the end of a REM period, and write its length. Lengths vary a little around 90 minutes.
Annotate the pattern
Point out deep sleep clustering in the first two cycles, REM growing later in the night, and brief wakings that most people never remember.
FAQQuestions
Common questions.
What are the stages of sleep?
Sleep is divided into non-REM and REM sleep. Non-REM has three stages: N1, the drowsy transition; N2, light sleep, which takes up the largest share of the night; and N3, deep or slow-wave sleep. REM sleep, with rapid eye movements, is when most vivid dreaming happens.
How long is one sleep cycle?
Roughly 90 minutes on average, although individual cycles range from about 70 to 120 minutes. Early cycles hold more deep N3 sleep, and later ones hold longer REM periods, which is why a full night usually contains four to six cycles.
How is a hypnogram recorded?
Usually from polysomnography, an overnight study that records brain waves, eye movements and muscle tone with sensors on the head and face. A trained scorer assigns a stage to each 30-second block. Wearable trackers estimate stages less precisely, from movement and heart rate.
More health and science templates
Patient guides, care pathways and the life sciences.