Free templateHealth and science
Graphical abstract
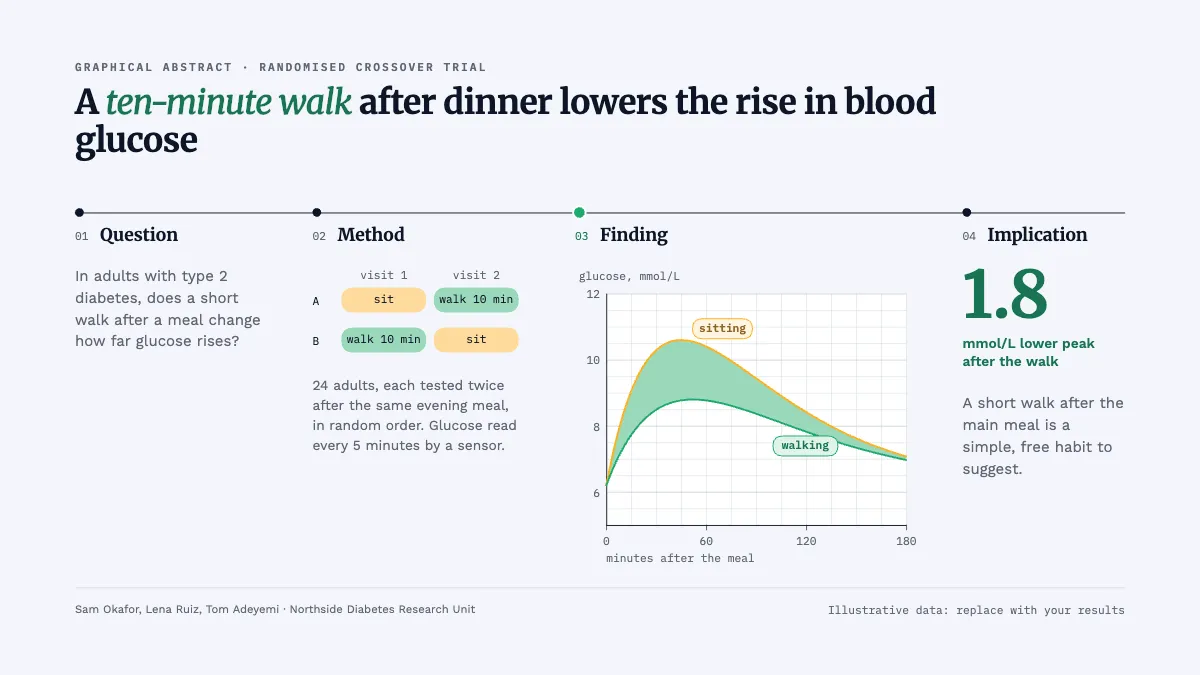
A research summary read left to right: question, method, a computed finding chart and the implication.
Free. It opens in the Motionix editor as your own copy.
Download the pictureWebP, 1200 × 675, free to use. To change the words or colours, open it in the editor.
- Size
- 1920 × 1080 px
- Pages
- 1
- Motion
- Yes, plays live and in GIF or video
- Category
- Health and science
What it shows
- Computed glucose curves
- Crossover design drawn
- One horizontal read
Good for
How to use it
- Open the template. It becomes a project in your account.
- Change the words, colours and pictures. Every part is an ordinary shape, line or text box.
- Press Play to watch it build, then present it or export it.
What is a graphical abstract?
A graphical abstract is a single image that summarises the main finding of a research paper, so a reader can grasp what was asked, how it was tested and what was found before reading the text. Many journals ask for one at submission and show it in tables of contents, search results and social posts. It usually reads in one direction, left to right or top to bottom.
When it helps
- Submitting a paper to a journal that requires a graphical abstract alongside the written one.
- A conference poster or slide that has to explain a study in seconds.
- Sharing a newly published paper on social media, where an image travels further than a link.
- A research unit's annual report summarising several studies for funders and the public.
Tips
- Keep text to a few words per panel; if it needs paragraphs to make sense, it is a figure, not a graphical abstract.
- Never use illustrative numbers in a submitted version; a placeholder chart that slips through misrepresents the study.
- Show it to a colleague outside your field for five seconds and ask what the study found; their answer is your test.
How to make a graphical abstract
Find the one main finding
Write the headline result as one sentence before drawing anything. A graphical abstract carries one message; secondary findings belong in the paper.
Choose a reading direction
Arrange the panels in one line, usually question, method, finding and implication, so the eye never has to decide where to go next.
Draw the method simply
Show the study design as a picture, for example two groups swapping conditions in a crossover trial, with sample size and the measure used.
Plot the key result
Use a simple chart from the real data with labelled axes and units, and put the size of the effect in large type beside it.
Check the journal's rules
Read the author guidelines for size, file format, fonts and whether text is allowed, and check the image is legible at thumbnail size.
FAQQuestions
Common questions.
What is the difference between a graphical abstract and a figure?
A figure presents detailed data in support of the paper's argument and is read alongside the text. A graphical abstract summarises the whole study in one image for someone who has not read the paper, so it simplifies, leaves out detail and focuses on the main finding.
Do all journals require a graphical abstract?
No. Many journals, particularly in the life, physical and medical sciences, request or require one, while others do not accept them at all. The journal's guide for authors states whether one is needed and gives the size and format.
What software can you use to make a graphical abstract?
Any tool that produces a clean, high-resolution image works, from general drawing and presentation software to vector illustration programs and scientific illustration services. What matters more is a clear structure, readable labels at small sizes and the format the journal asks for.
More health and science templates
Patient guides, care pathways and the life sciences.