Free templateOrg chart
Clinic org chart
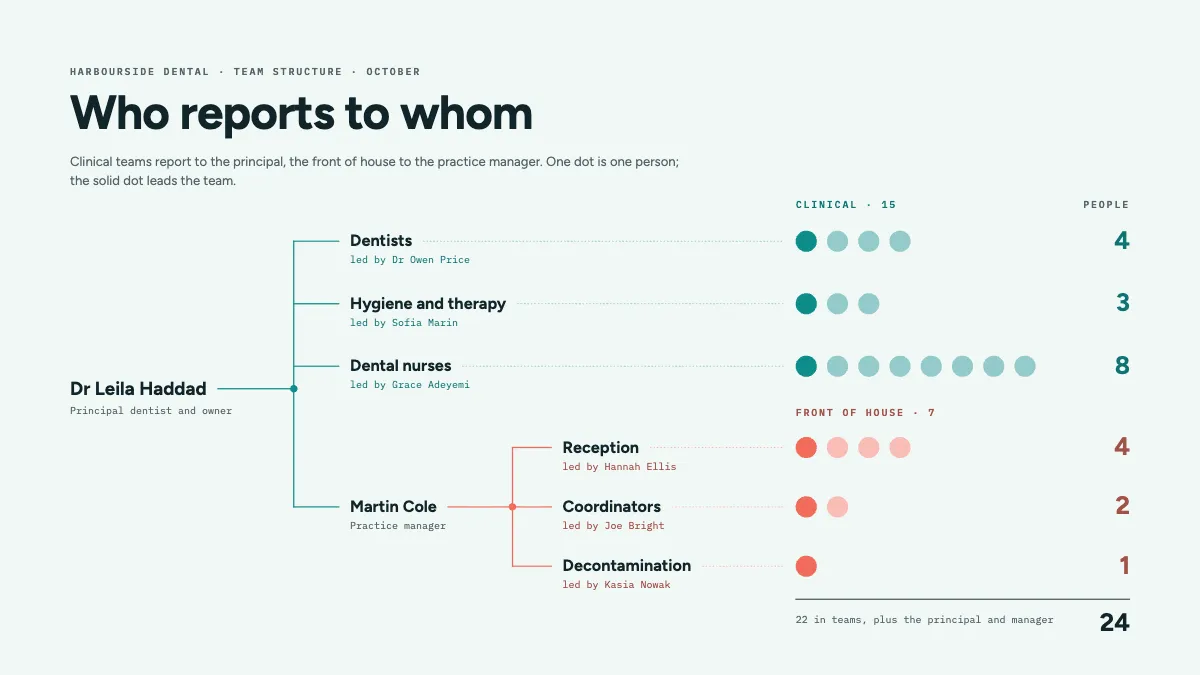
A 24-person dental practice where every person is a dot, so the tree shows reporting lines and team sizes at once.
Free. It opens in the Motionix editor as your own copy.
Download the pictureWebP, 1200 × 675, free to use. To change the words or colours, open it in the editor.
- Size
- 1920 × 1080 px
- Pages
- 1
- Motion
- Yes, plays live and in GIF or video
- Category
- Frameworks
What it shows
- Elbow reporting lines
- Headcount drawn as dots
- Two tinted branches
Good for
How to use it
- Open the template. It becomes a project in your account.
- Change the words, colours and pictures. Every part is an ordinary shape, line or text box.
- Press Play to watch it build, then present it or export it.
What is an org chart?
An org chart, or organisational chart, is a diagram of who reports to whom. Each node is a person or a role, and the lines between them are reporting lines running from a manager to the people they manage. A good one also shows how teams are grouped, how big each team is and who leads it, so a newcomer can find the right person in seconds.
When it helps
- Onboarding a new receptionist who needs to know who leads each team and who to ask about what.
- Planning a hire, by seeing which team is largest for its lead and where a manager has too many reports.
- A practice owner explaining to a buyer or investor how the business runs day to day.
- Spotting a single point of failure, such as a one-person team with nobody to cover holidays.
Tips
- Chart roles as well as names, so the drawing survives staff changes and shows a vacant post as clearly as a filled one.
- Colour branches by function, such as clinical and front of house, so readers see the shape of the organisation before they read a single name.
- Dotted lines for project or informal reporting help, but use them sparingly; add four of them and nobody can tell who the real manager is.
How to make an org chart
List people and their managers
Start from a spreadsheet with three columns: name, role and who they report to. Every chart is drawn from this list, and gaps such as missing managers show up before you draw anything.
Choose the direction
Top-down trees suit small organisations. A left-to-right tree fits a wide slide and leaves room for names, and large teams can sit on one row instead of as separate boxes.
Place the head of each branch
Draw the owner or chief executive first, then the people who report to them directly. These are the branches that everyone else hangs from.
Use elbow lines
Run a straight stem from each manager to a shared bar, then a short tick to each report. Right-angled lines read far more clearly than diagonals once a manager has several reports.
Show leads and headcount
Mark each team's lead and its size, with one dot or box per person for small teams. Check the team counts add up to the total headcount.
Date it and keep it current
Write the month on the chart. An org chart goes stale the day someone joins or leaves, so update it with every change rather than once a year.
FAQQuestions
Common questions.
What are the main types of org chart?
Hierarchical charts show a chain of command from the top down and are the most common. Functional charts group people by department. Matrix charts show people with two managers, such as a project lead and a department head. Flat charts show few layers between the top and everyone else.
What is a span of control?
It is the number of people who report directly to one manager. Wide spans mean fewer layers but less time for each person; narrow spans mean more managers. A common rule of thumb is five to ten direct reports, though the right number depends on how similar the work is.
Should an org chart show every employee?
In a small organisation, yes: it helps everyone know each other. In a larger one, show leaders and team names with headcounts, and keep a separate chart for each department. A chart with hundreds of boxes on one page is too small to read.
More frameworks templates
Matrices, org charts, canvases and models for thinking.