Free templateFishbone diagram
Late deliveries fishbone
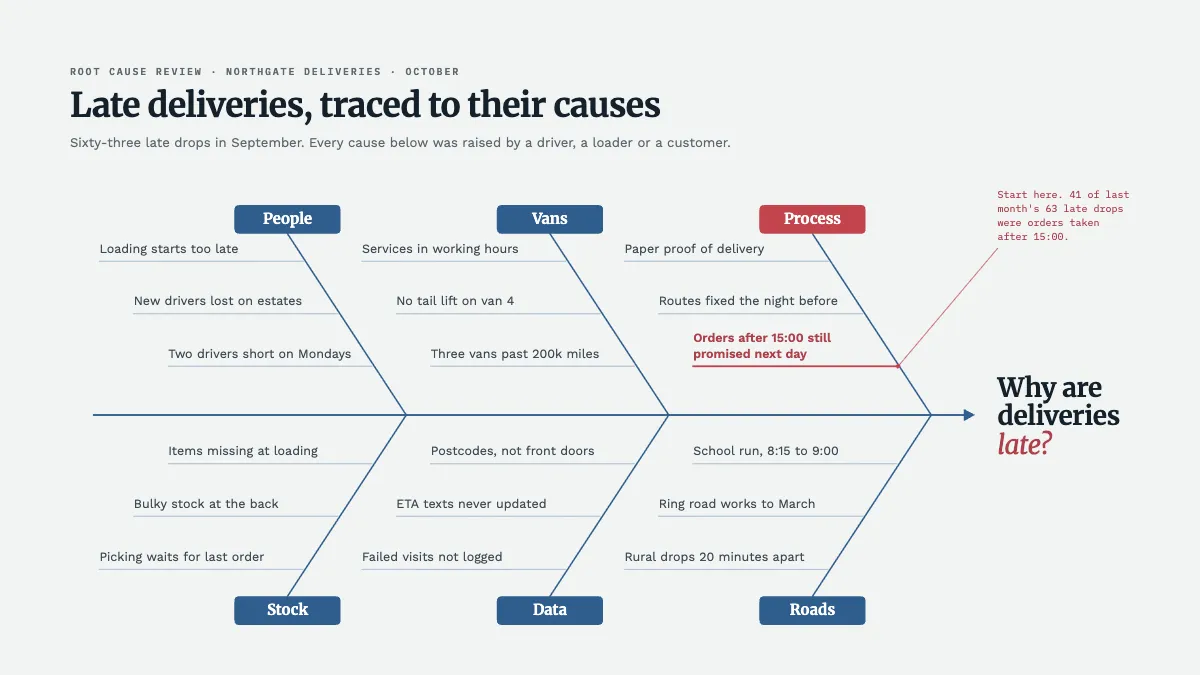
An Ishikawa diagram asking why deliveries are late, with six bones of real causes and the likely root cause marked with its evidence.
Free. It opens in the Motionix editor as your own copy.
Download the pictureWebP, 1200 × 675, free to use. To change the words or colours, open it in the editor.
- Size
- 1920 × 1080 px
- Pages
- 1
- Motion
- Yes, plays live and in GIF or video
- Category
- Frameworks
What it shows
- Fine-line fishbone
- Root cause in the accent
- Bones draw on in turn
Good for
How to use it
- Open the template. It becomes a project in your account.
- Change the words, colours and pictures. Every part is an ordinary shape, line or text box.
- Press Play to watch it build, then present it or export it.
What is a fishbone diagram?
A fishbone diagram, also called an Ishikawa or cause-and-effect diagram, sets out the possible causes of a problem so a team can search for the root cause. The problem sits at the head of the fish, a spine runs to it, and each bone is a category of causes, such as people, methods, machines, materials, measurement and environment. Kaoru Ishikawa made it a standard quality tool in Japan.
When it helps
- An operations team investigating why a growing share of deliveries arrive late.
- A quality review after a run of defects, before anyone proposes a fix.
- A workshop where everyone involved suggests causes, so blame does not land on one group.
- A report to management showing which causes were considered and the evidence for the chosen one.
Tips
- Rename the categories to fit the trade. Vans, roads and stock mean more to a delivery firm than machines, environment and materials, and people offer more causes in their own words.
- Write each cause as a checkable fact, like "routes fixed the night before", rather than a judgement like "bad planning". Facts can be tested; judgements start arguments.
- A fishbone finds candidates, not answers. Ending the session without a way to test the top two or three causes lets the loudest voice pick the fix.
How to make a fishbone diagram
Write the problem as a question
Put a specific problem at the head, such as "why are deliveries late?", ideally with its size: 63 late drops last month. A vague problem attracts vague causes.
Draw the spine and bones
Run a horizontal line to the head and add four to six diagonal bones. Label each with a category; the 6Ms are a common start, renamed to suit your work.
Brainstorm causes on each bone
Ask the people who do the work what makes the problem happen, and add each cause as a short rib on its bone. Collect causes, not symptoms or solutions.
Ask why again
For each cause, ask why it happens and add the answer as a smaller rib. Stop when you reach something a person can actually change.
Check the causes against data
Mark the causes the evidence supports, such as how many late drops trace back to orders taken after 15:00. The diagram lists suspects; data identifies the root cause.
Act on the strongest cause
Choose a fix for the cause with the most evidence behind it, then measure the original problem again to see whether it moved.
FAQQuestions
Common questions.
What are the 6 Ms of a fishbone diagram?
Manpower (people), machines, methods, materials, measurement and mother nature, meaning the environment. They come from manufacturing and give a team a checklist of places to look. Service businesses often use the 4 Ps instead: policies, procedures, people and plant.
What is the difference between a fishbone diagram and the 5 whys?
The 5 whys follows a single chain of causes by asking "why?" over and over. A fishbone spreads the search across several categories at once. They work well together: draw the fishbone to list possible causes, then run the 5 whys on the most likely ones.
Why is it called a fishbone diagram?
Because the finished drawing looks like a fish skeleton: the problem is the head, the main line is the spine and the cause categories branch off like bones. It is also called an Ishikawa diagram after Kaoru Ishikawa, the Japanese quality expert who made it widely known in the 1960s.
More frameworks templates
Matrices, org charts, canvases and models for thinking.