Free templateResearch presentation
Research talk: street trees
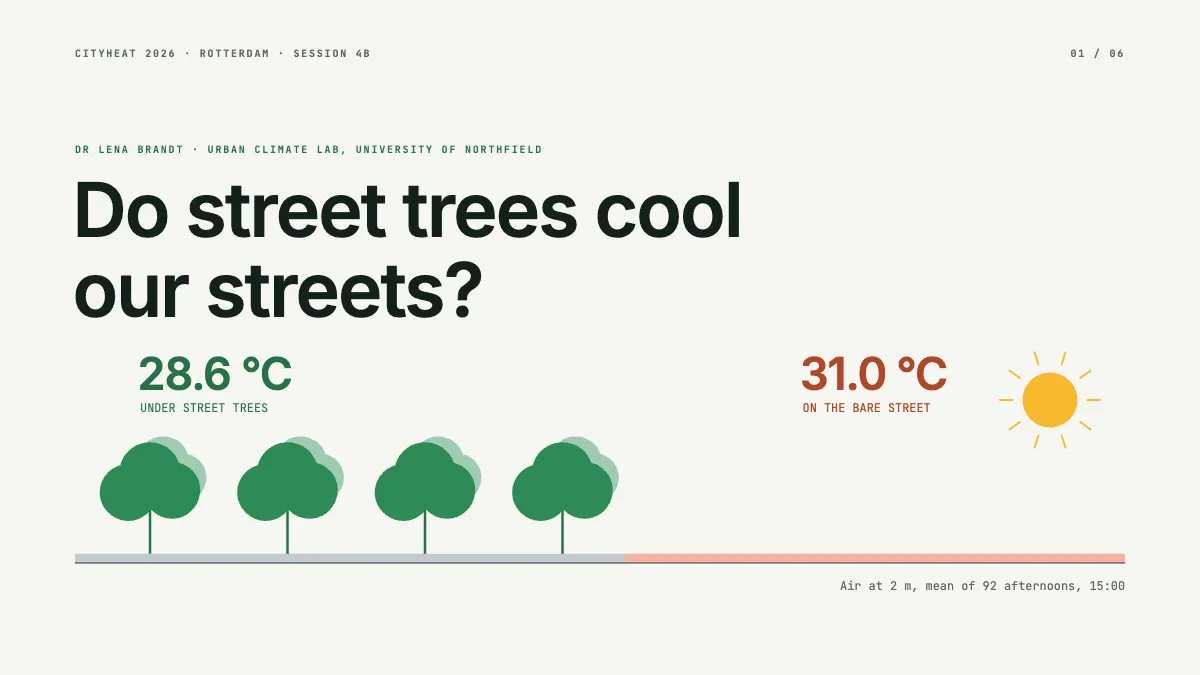
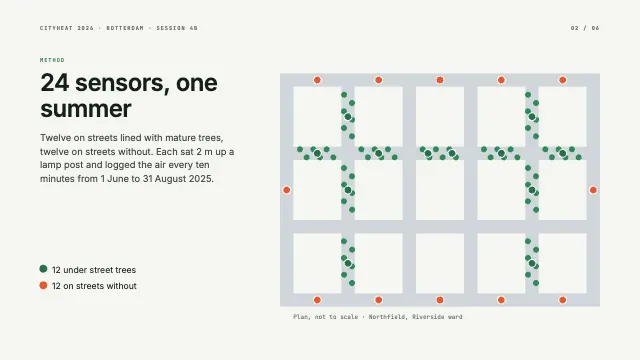
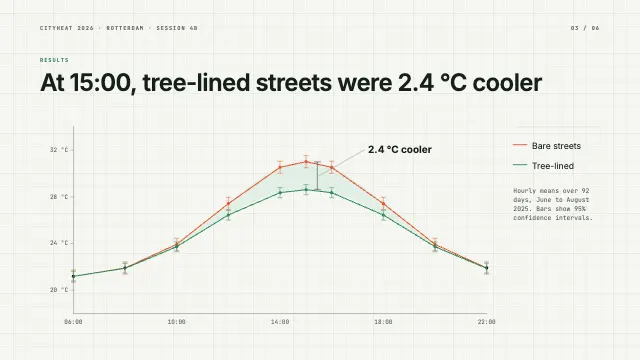
A six-page conference talk on whether street trees cool a street: a drawn plan of 24 sensors and a temperature chart with error bars showing 2.4 °C.
Free. It opens in the Motionix editor as your own copy.
Download the pictureWebP, 1200 × 675, free to use. To change the words or colours, open it in the editor.
- Size
- 1920 × 1080 px
- Pages
- 6
- Motion
- Yes, plays live and in GIF or video
- Category
- Presentations
Every page
 Page 2
 Page 3
 Page 4
 Page 5
 Page 6
What it shows
- A study area drawn as a plan
- A chart with confidence intervals
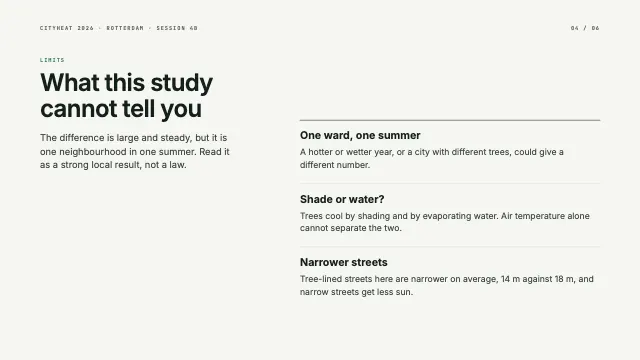
- Limits stated plainly
Good for
How to use it
- Open the template. It becomes a project in your account.
- Change the words, colours and pictures. Every part is an ordinary shape, line or text box.
- Press Play to watch it build, then present it or export it.
What is a research presentation?
A research presentation reports a study to an audience of peers, usually at a conference or seminar: the question, the method, the main result with its uncertainty, the limitations and the conclusion. Conference talks are often 10 to 20 minutes long, so the slides must carry one finding clearly and show enough of the method for the audience to judge whether to believe it.
When it helps
- PhD students presenting a thesis chapter in a conference session.
- Researchers sharing findings with a city council or with practitioners.
- Lab or department meetings where a study is presented before submission.
- A thesis defence, where the methods and limits face close questioning.
Tips
- Rehearse aloud, to time, at least twice. Sessions run strictly, and running over usually eats into the questions, where the useful discussion happens.
- Label chart axes in large type and remove whatever your point does not need; projectors and back rows wash out fine detail.
- Answer the obvious objection on a slide before anyone raises it. The question period then becomes a conversation rather than a defence.
How to make a research presentation
Open with the question
State the research question in plain words as the title, such as do street trees cool our streets. A clear question tells the audience what to listen for.
Picture the study design
A plan of the study area with each sensor marked, or a diagram of the experiment, explains the method faster than a paragraph of text.
Present one main result
Build the central chart slowly and title it with the finding, for example at 15:00 tree-lined streets were 2.4 °C cooler.
Show the uncertainty
Include error bars or confidence intervals and say what they represent. A research audience will ask, and showing them first builds trust.
State the limitations plainly
Give a whole slide to what the study cannot tell you, such as one ward over one summer, or a confounder like narrower streets getting less sun.
Close with the answer and contacts
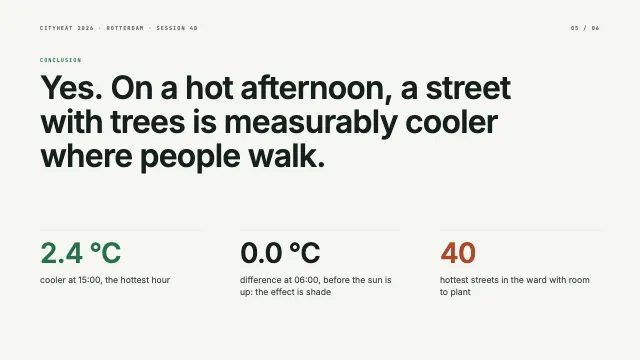
Answer the question in one sentence, then show your email, where the data and code are published, and the status of the paper.
FAQQuestions
Common questions.
How many slides for a 15 minute research presentation?
Typically 10 to 15, at about a minute per slide, though result slides that build in stages take longer. Plan the time around the main result rather than the count, and keep backup slides after the closing slide for likely questions.
How do you structure a research presentation?
Question and motivation, methods, results, limitations and conclusion, closing with thanks and contact details. Give most of the time to the results and keep the literature review short, because a conference audience usually knows the field already.
What does a 95% confidence interval show on a chart?
It is a range computed from the data that would contain the true value in 95% of repeated samples, drawn as error bars around each estimate. When the intervals for two groups do not overlap, the difference between them is unlikely to be due to chance alone.
More presentations templates
Decks for pitches, lectures, reviews and talks.