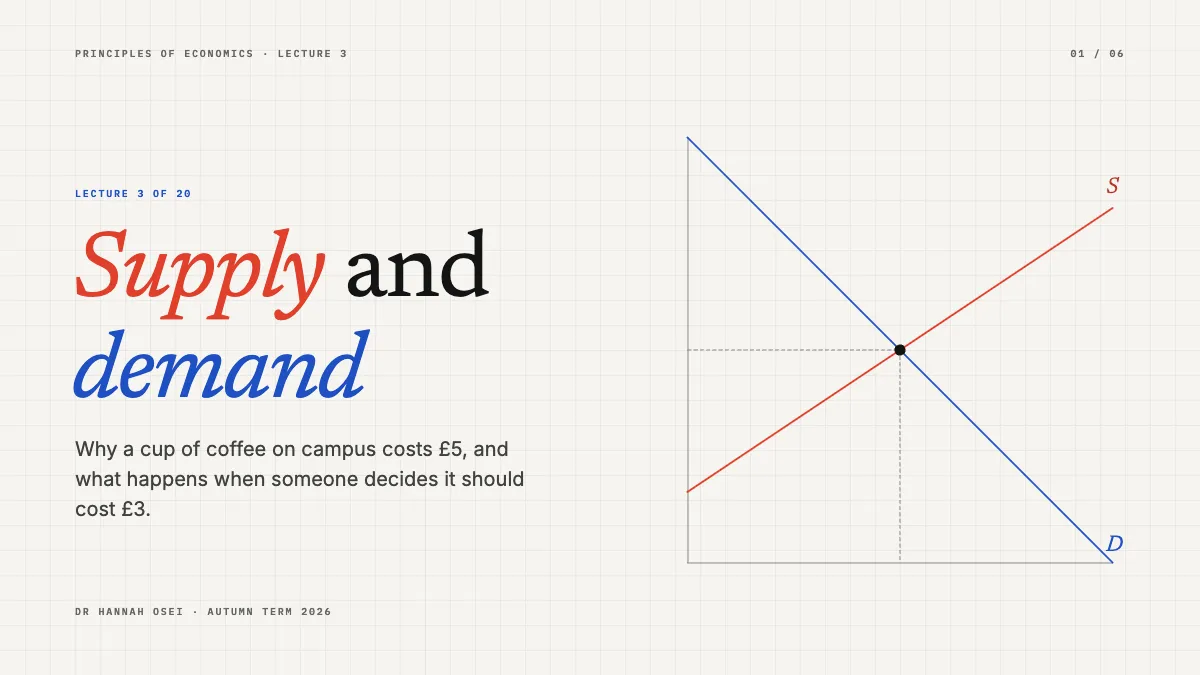
Free templateLecture slides
Lecture: supply and demand
A six-page economics lecture on one computed market: the curves, the equilibrium, a shift in demand and the shortage a price ceiling makes.
Free. It opens in the Motionix editor as your own copy.
Download the pictureWebP, 1200 × 675, free to use. To change the words or colours, open it in the editor.
- Size
- 1920 × 1080 px
- Pages
- 6
- Motion
- Yes, plays live and in GIF or video
- Category
- Presentations
Every page
 Page 2
 Page 3
 Page 4
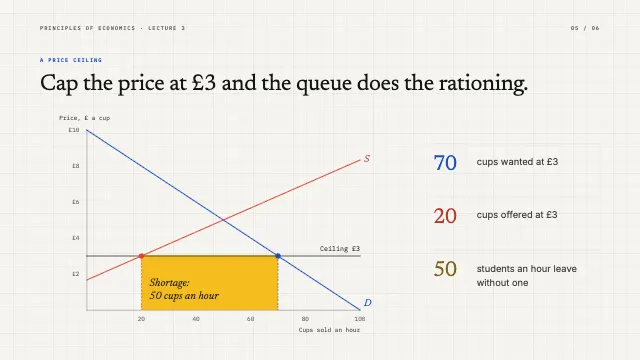 Page 5
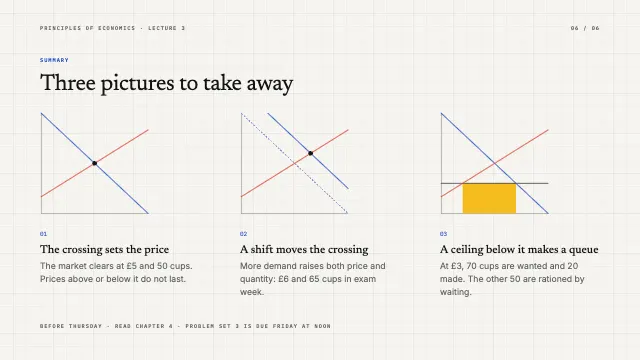 Page 6
What it shows
- Curves computed from their equations
- The same axes on every page
- A shortage drawn to scale
Good for
How to use it
- Open the template. It becomes a project in your account.
- Change the words, colours and pictures. Every part is an ordinary shape, line or text box.
- Press Play to watch it build, then present it or export it.
What are good lecture slides?
Good lecture slides support what the lecturer says rather than replacing it: one idea per slide, a title that states the point, and diagrams students can copy and reason with. In a subject built on models, such as economics, the best decks keep the same axes on every slide, so a shift of a curve or a price ceiling is seen as a change to one familiar picture.
When it helps
- Introductory economics lectures on supply, demand, equilibrium and price controls.
- Recorded lessons where the slides must still make sense on a small laptop screen.
- Slides posted on the course page for students to revise from before an exam.
- Teaching any model that changes step by step, such as a curve shifting outwards.
Tips
- Reveal a graph in stages: axes, one curve, then the other. Showing the finished diagram first makes students copy it rather than follow the argument.
- Put definitions and derivations in the handout, not in bullet points on screen, so students can listen while you explain.
- Draw a shortage or surplus to scale, as a visible gap between the curves, so the size of the effect is seen and not only stated.
How to make lecture slides
Plan one claim per slide
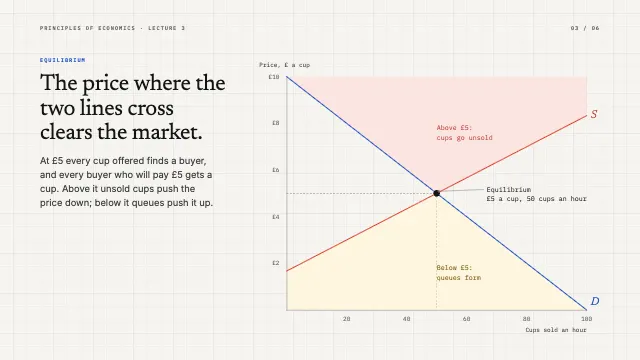
Each slide should carry a single point, written as its title, such as the price where the lines cross clears the market. The spoken lecture then supplies the reasoning.
Draw graphs from real equations
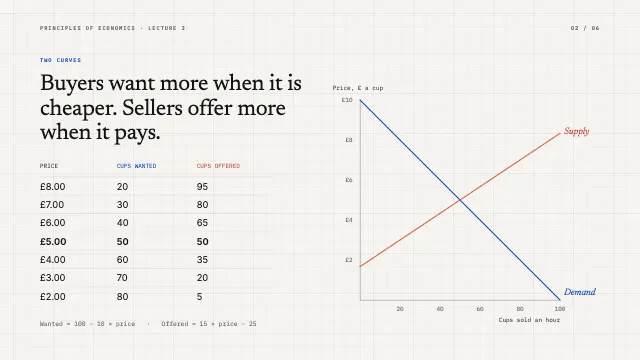
Plot curves from the equations you give students, for instance quantity wanted equals 100 minus 10 times the price. Students can then check every point for themselves.
Keep the axes fixed
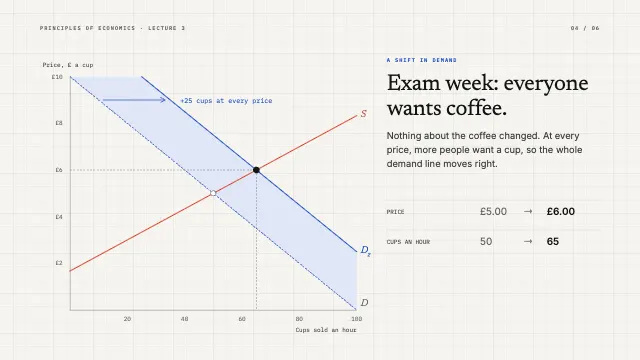
Use the same axes, scale and position on every slide about one model. When only the curve moves, students see the change instead of rebuilding the picture in their heads.
Anchor theory in a familiar market
Abstract models stick when tied to something students know, like coffee during exam week. A concrete market makes shifts, shortages and queues easy to imagine.
End with takeaways and the next task
Close with three pictures to remember and what is due next, such as the chapter to read and the problem set deadline before the following session.
FAQQuestions
Common questions.
How many slides do you need for a one hour lecture?
There is no fixed rule, but many lecturers use roughly one slide for every two or three minutes of talk, so around 20 to 30 for an hour. Fewer slides with richer diagrams often teach better than many slides of bullet points.
Should lecture slides be shared before the lecture?
Many students find it helpful, because they can annotate rather than copy. Some lecturers share a gapped version with key answers removed, so students still have something to listen for and complete during the session.
What happens when a price ceiling is set below equilibrium?
At the capped price buyers want more than sellers will supply, so a shortage appears and something other than price rations the good: queues, waiting lists, favouritism or a black market. A ceiling set above equilibrium has no effect, since the market price is already lower.
More presentations templates
Decks for pitches, lectures, reviews and talks.