Free templateGantt chart
Kitchen renovation plan
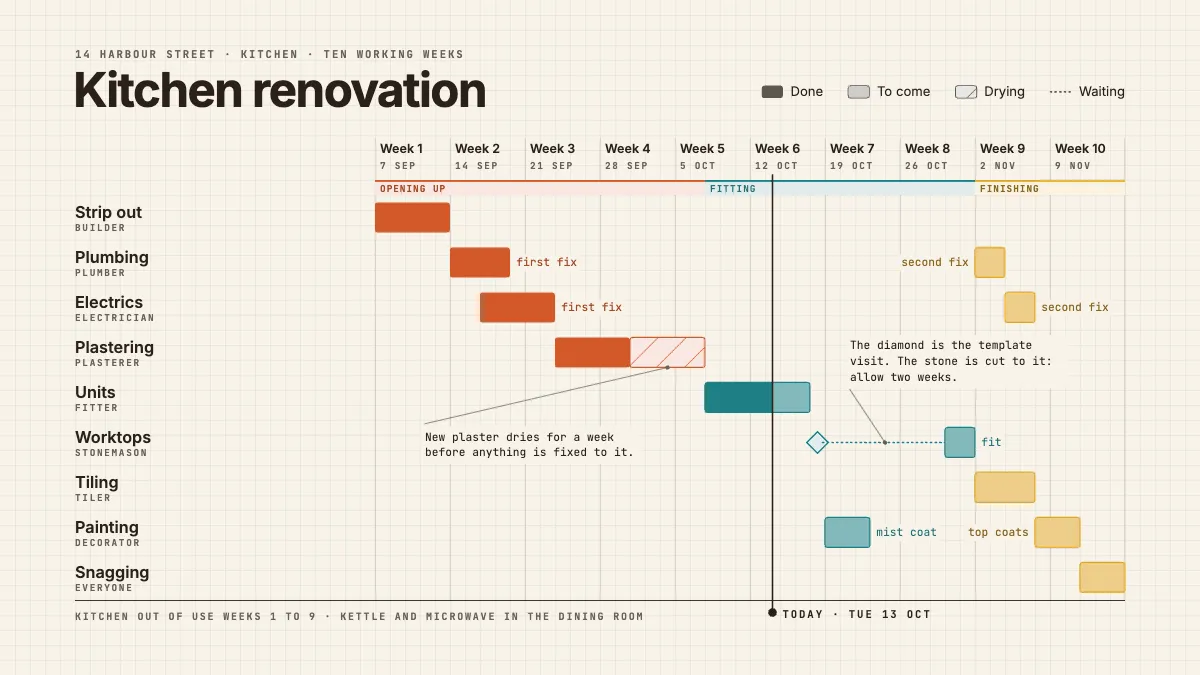
A ten-week Gantt chart for a kitchen refit, every trade at its true length, with drying time, a wait for stone and a today line.
Free. It opens in the Motionix editor as your own copy.
Download the pictureWebP, 1200 × 675, free to use. To change the words or colours, open it in the editor.
- Size
- 1920 × 1080 px
- Pages
- 1
- Motion
- Yes, plays live and in GIF or video
- Category
- Plans
What it shows
- Gantt chart from real dates
- Done and to come split at today
- Notes with leaders
Good for
How to use it
- Open the template. It becomes a project in your account.
- Change the words, colours and pictures. Every part is an ordinary shape, line or text box.
- Press Play to watch it build, then present it or export it.
What is a Gantt chart?
A Gantt chart is a bar chart of a project's schedule: tasks run down the left, time runs across the top, and each task is a bar as long as it lasts, placed where it starts. Named after Henry Gantt, who popularised it in the 1910s, it shows at a glance what happens when, what overlaps and what must wait for something else.
When it helps
- A builder showing a homeowner when each trade arrives during a ten-week kitchen refit.
- A project manager spotting that two tasks need the same person in the same week.
- Tracking progress against plan, with a today line splitting work done from work to come.
- Explaining to a client why a delay in one trade pushes back every task after it.
Tips
- Show waiting time as its own bar or pattern. Drying, curing and delivery lead times are where real projects slip, and hiding them makes the plan look shorter than it is.
- Find the critical path, the chain of dependent tasks with no slack. Delay anything on it and the finish date moves; delay anything else and it may not.
- Update the chart weekly rather than redrawing it from scratch. Keeping the original dates alongside shows how the plan has drifted and why.
How to make a Gantt chart
List the tasks
Break the project into tasks small enough to schedule, each done by one trade or team, such as strip out, first fix plumbing, plastering and fitting the units.
Estimate each duration
Give every task a realistic length in working days, including the waits that are not work, such as plaster drying or a supplier cutting worktops to measure.
Find the dependencies
Note which tasks cannot start until another finishes. In a kitchen, plastering follows the first fix of electrics and plumbing, and tiling waits for the worktops.
Draw the time scale
Lay out the calendar across the top in days or weeks, from real dates, and leave weekends and holidays out of a working-day project.
Place the bars
Draw each task as a bar from its start to its finish, in order of start date. Mark milestones, like a worktop template visit, as diamonds rather than bars.
Add a today line
Draw a vertical line at today and shade finished work differently from work to come, so progress can be read in a second.
FAQQuestions
Common questions.
Who invented the Gantt chart?
The chart is named after Henry Gantt, an American engineer and management consultant who developed and popularised it around 1910 to 1915. A similar chart, the harmonogram, had been devised by the Polish engineer Karol Adamiecki in the 1890s, but it was published mainly in Polish and Russian and was little known in the West.
What is the critical path in a Gantt chart?
The critical path is the longest chain of dependent tasks from the start of a project to its end. Tasks on it have no float, so any delay to one of them delays the whole project. Many planning tools highlight these bars so a project manager knows where to focus.
What is the difference between a Gantt chart and a timeline?
A timeline shows events or milestones in order along a single line. A Gantt chart gives each task its own row and bar, so durations, overlaps and dependencies are visible. Timelines suit summaries for an audience; Gantt charts suit planning and tracking the work itself.
More plans templates
Timelines, schedules, itineraries and trackers.